Unfortunately, as a firm of one, I don’t have an editorial or graphic arts department, which would improve – considerably – the quality of the weekly blog posts, so this is the best that can be done for now.
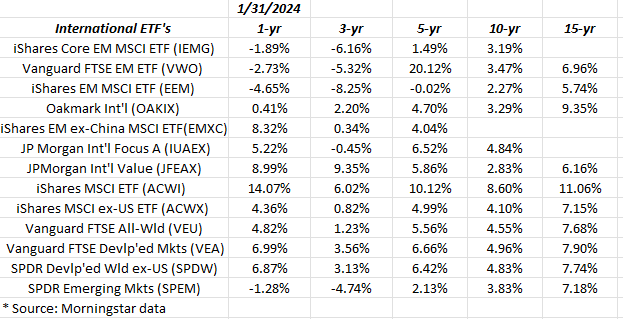
The above spreadsheet shows the annual returns for many international benchmarks, but also included are some noted international funds like Oakmark International for comparative display.
For comparison purposes, here are the annualized returns for the main US indices for the same time period:
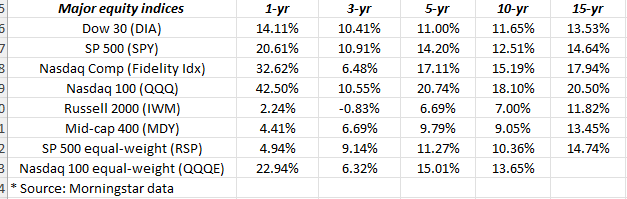
Look at the 1-year return for the US indices versus the International benchmarks.
Looking across the other annual return buckets, i.e. 3,5 and 10-year, the comparative returns aren’t much better.
David Herro was interviewed on CNBC the last few weeks, and he noted “international” equity valuations are the lowest they’ve been in 20 years relative to the US equity market.
For those who have been managing since the late 1990’s, who witnessed the colossal rotation that took place starting in mid-March, 2000, and that lasted until 2007, from large-cap tech and growth to anything that essentially went nowhere from 1995 to mid-March, 2000, i.e. small and mid-caps, emerging markets, international, and any value style of investing, you could very well make the same case exists today, with the exception of the notable frenzy of large-cap growth in the late 1990’s in terms of investor sentiment that is absent today.
What David didn’t mention was that China was growing 15% per year in terms of annual GDP growth (in the period from the early 2000’s to the late 2000’s, China became the world’s 2nd largest economy in terms of annual GDP), so that new “giant sucking sound” Ross Perot originally articulated in the 1992 US Presidential election, was China’s influence on the globe’s emerging market and international, developed, economies for a decade or more.
The point being that China’s exceptionally strong GDP growth may have been a considerable factor in the outperformance of international and emerging markets in the 2000’s.
China’s weight in the emerging market universe is typically 30% of the EM benchmarks, but (in my opinion) China remains uninvestable.
Today, China’s growth is hampered by Evergrande, and notoriously bad economic policies thanks to the CCP. No question a considerable chill descended on China (in my opinion) when the CCP and Xi Xinping called off the Ant Financial IPO saying the IPO represented “considerable risks” to the Chinese financial system, but really it was Jack Ma and the success of capitalism that represented a bigger risk to the Chinese Communist Party.
Clients had a position in the Vanguard Emerging Market ETF (VWO) until 2017 when Jimmy Lei, the editor of the Apple News Daily in Hong Kong, was jailed for treason because of his “pro-democracy” editorials, and then the VWO was sold entirely. No direct exposure in China is held today, although owning large-cap tech companies and consumer names like Nike (NKE) and Tesla (TSLA) have operations in China.
Clients largest international, non-US holdings that comprise roughly 15% – 20% of the majority of client accounts:
- Oakmark International;
- Emerging Markets ex-China (EMXC):
- Vanguard FTSE Developed Markets;
Top 10 Client holdings as of 12/31/23: (’23 total return included)
- JP Morgan Income Fund (JMSIX): +7.06%
- Microsoft (MSFT): +58%
- Oakmark International (OAKIX): +18.8%
- JP Morgan (JPM): +29.8%
- Amazon (AMZN): +81%
- Nasdaq 100 (QQQ): +55%
- Charles Schwab (SCHW): -16%
- Emerging Markets ex-China (EMXC): +19%
- SP 500 ETF (SPY): +26.28%
- Barclay’s Aggregate: (AGG): +5.65
Summary / conclusion: The point of today’s missive is that whether it’s international or emerging markets, or the “equal-weight SP 500” or the Russell 2000 (IWM) or the SP 400 mid-cap, there are places you can look for “uncorrelated” return outside of the main US equity market indices, without timing the markets.
It’s hard to say what might catalyze the international, Non-US markets, relative to the SP 500.
The better strategic allocation bet might be the SP 500 equal-weight, the Russell 2000, and other US indices that are well behind the US benchmarks.
I talk to a lot of portfolio managers that all say the same thing about “international”: it’s typically a dead weight until it isn’t.
Does the US dollar matter ? Absolutely, but with the higher US “real” interest rates in the US Treasury market, it makes a tough to see a prolonged weakening in the dollar, vis-a-vis Europe or anywhere else.
One potential catalyst could be an easing of monetary policy in the US, which is typically followed by the other global central banks, but given the January ’24 jobs report and last week’s hotter inflation data, the odds of the FOMC lowering interest rates in the next few months seems unlikely now. (The bond market and the cacophony of lower interest rate calls will be the topic of a separate article.)
None of this is advice or a recommendation. Past performance is no guarantee or suggestion of future results. Investing can involve the loss of principal, even over short periods of time. This blog’s Top 10 holdings have been occasionally listed for the last several years, given that a lot of the writing done for individual companies (i.e. stocks) is on out-of-favor stocks or smaller positions. The individual client positions can change at any time. Readers should gauge your own comfort level with portfolio volatility, and adjust portfolios accordingly.
Thanks for reading.