The first week of 2024, the SP 500 has backed away from it’s all time (trading) high of 4,818, from the first week of January, 2022, and at least according to Ayesha Tariq, author of the MacroVisor blog, the Nasdaq is off to it’s weakest start since January, 2008.
Source: MacroVisor blog 1/5/24
The source of the data point can’t be recalled, but I thought I read that January’s of Presidential election years, tend to be a poor-returning month.
Using Ycharts, and their total calculator (Sp 500 total return), here’s what is shown as the January return for election years since 2000:
- January ’24: ?
- January ’20: -1%
- January ’16: +5.78%
- January ’12: -0.58%
- January ’08: -6.0%
- January ’03: -3%
- January ’00: -5.02%
Readers could also reference the decade from 2000 to 2009 as the worst since the 1930’s, and pointing to the fact that an 80% Nasdaq correction began in March, 2000, and a 50% SP 500 correction, began in late, 2007, early 2008. The data could be skewed from that.
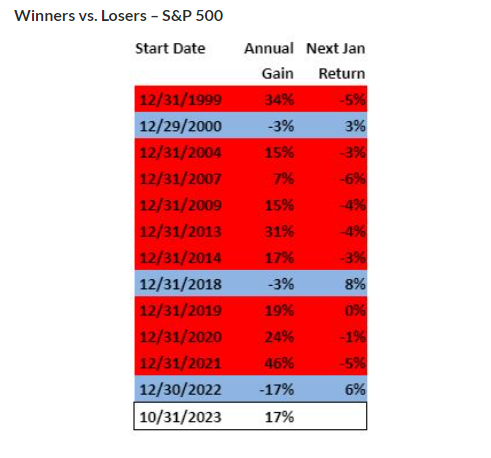
This table we posted in the 2024 preview here, which was sourced from Lawrence McDonald’s blog, Larry being the author of ” A Colossal Failure of Common Sense” another excellent book on the collapse of Lehman Brothers in September, 2008. the above table shows January returns following strong return years for the SP 500.
The point being, the deck looks stacked statistically, against a positive January ’24 return for the SP 500. However let’s see what the CPI and PPI data hold this week.
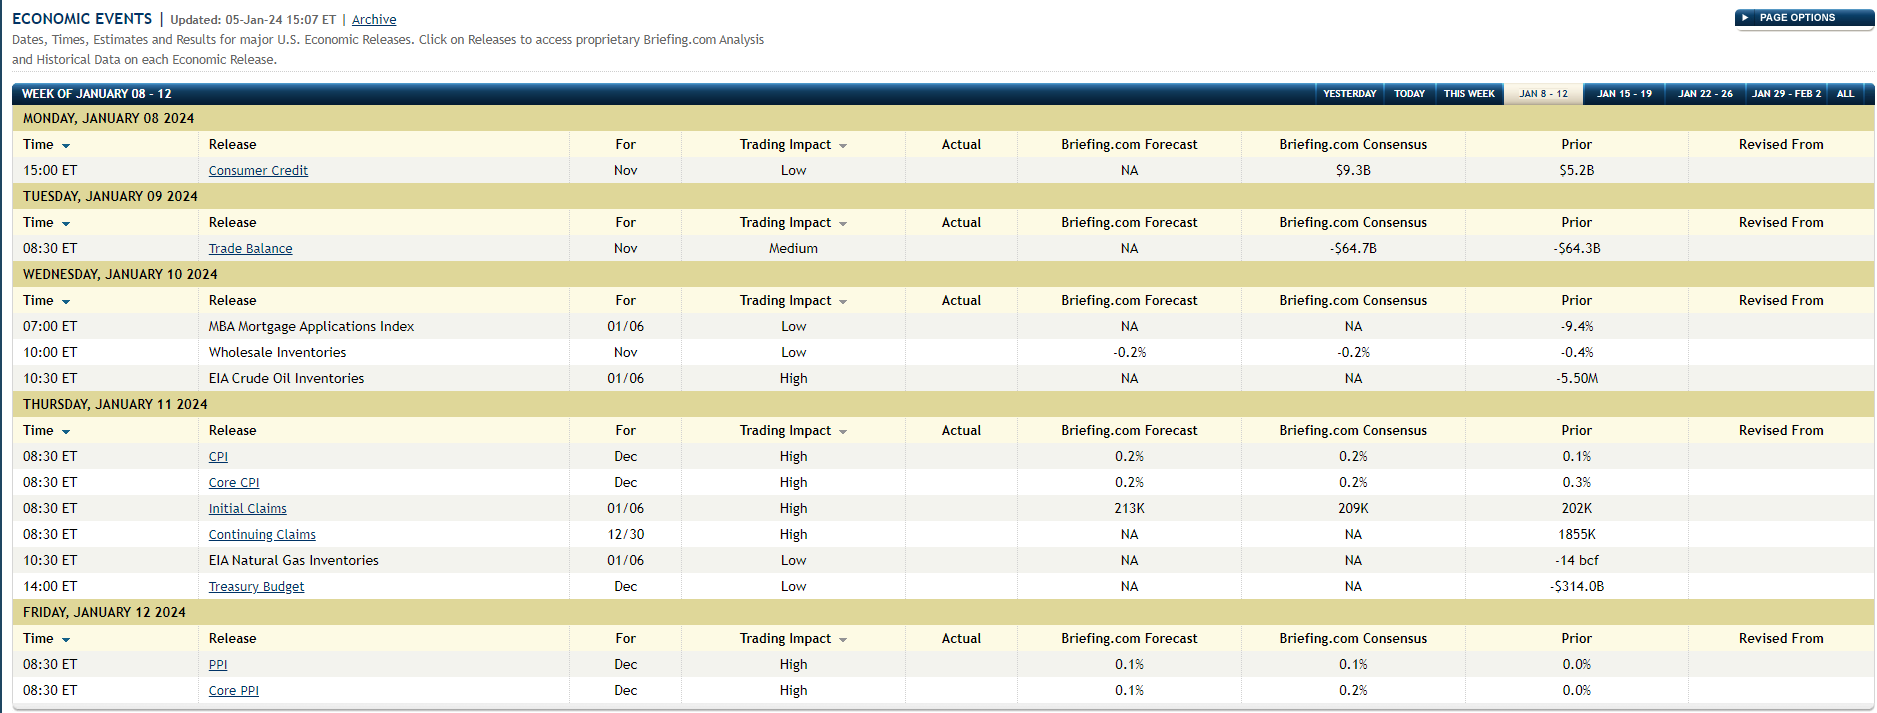
Source: Briefing.com economic calendar
Some are looking for a “hotter” or stronger-than-expected CPI for December, when we get the release Thursday morning, January 11th, 2024.
That may not be a bad thing either: any data point that helps Treasury yields rise a little after the torrid two-month rally from late October through end of December ’23, would help.
In our JP Morgan earnings preview, JPM’s stock may need a breakout to an all-time-high for the SP 500 above 4,818, to insure JPM stays above the old, October ’21 high. The two are probably tied at the hip.
What do the 2-year and 3-year “annual, total returns” look like for the major equity benchmarks ?
- SP 500: 2-year return: 1.75%, and 3-year return: 10.02%;
- DJIA: 2-year return: 2.10%, and 3-year return: 8.79%;
- Nasdaq: 2-year return: -1.05%, and 3-year return: 6.05%;
- Nasdaq 100: 2-year return: 2.59%, and 3-year return: 10.2%;
- Russell 2000 (IWM): 2-year return: 2.83%, 3-year return: 2.23%
- SP 400 Midcap (MDY): 2-year return: -0.52%, 3-year return: 6.52%;
Return source: Ycharts
The Nasdaq and Nasdaq 100 (QQQ) 2 and 3-year annual returns, even with the run in ’23, still look reasonable. (If you look at these data points too long, it will drive you insane.)
Summary / conclusion: All the bullish prognostications at the end of 2023, for 2024 return forecasts, have now suddenly turned cautious after one week of negative returns in 2024.
Predictions for the most part are useless, but the mainstream financial media is filled with them.
Personally, watch that 4,800 – 4,818 all-time-high for the SP 500 from the first week – 10 days of 2022. Maybe the market requires a stronger probability of fed funds rate cuts, before the SP 500 trades back above the 2022 high.
If we do see a down January, ’24, i.e. -3% to -5% decline in the SP 500, that’s not such a bad thing either.
You definitely don’t want to see a +5% 10-year Treasury yield under any circumstances.
None of this is advice or a recommendation. Past performance is no guarantee of futures results. All return data and calculations are sourced from reliable sources as noted, but any mistakes are my own. Capital markets can change quickly for both the good and the bad. Readers should gauge your own comfort level with portfolio volatility and adjust accordingly.
Thanks for reading.