Along with JP Morgan reporting their calendar Q4 ’23 financial results, on Friday morning, January 12th, 2023, Citigroup (C) and Bank of America (BAC) will do so as well. Having never covered or modeled Wells Fargo (WFC) for any period of time, even though they too will report Friday morning, the earnings will not be covered here.
Citigroup (C): Citigroup is a darling of world-class value investors like Bill Nygren of Oakmark and Warren Buffett’s Berkshire Hathaway, and when both noted they were buying the stock, I took an interest and bought some as well. Mike Mayo, the legendary bank analyst now at Wells Fargo, has come out in the last two weeks on a CNBC appearance and put a price target on Citi of $80 per share, which would be a doubling of the stock price from the late October ’23 lows.
With all due respect to Mayo though, Citi has traded up to $80 in early, 2018, early 2020, and then in early June ’21, according to this weekly chart:
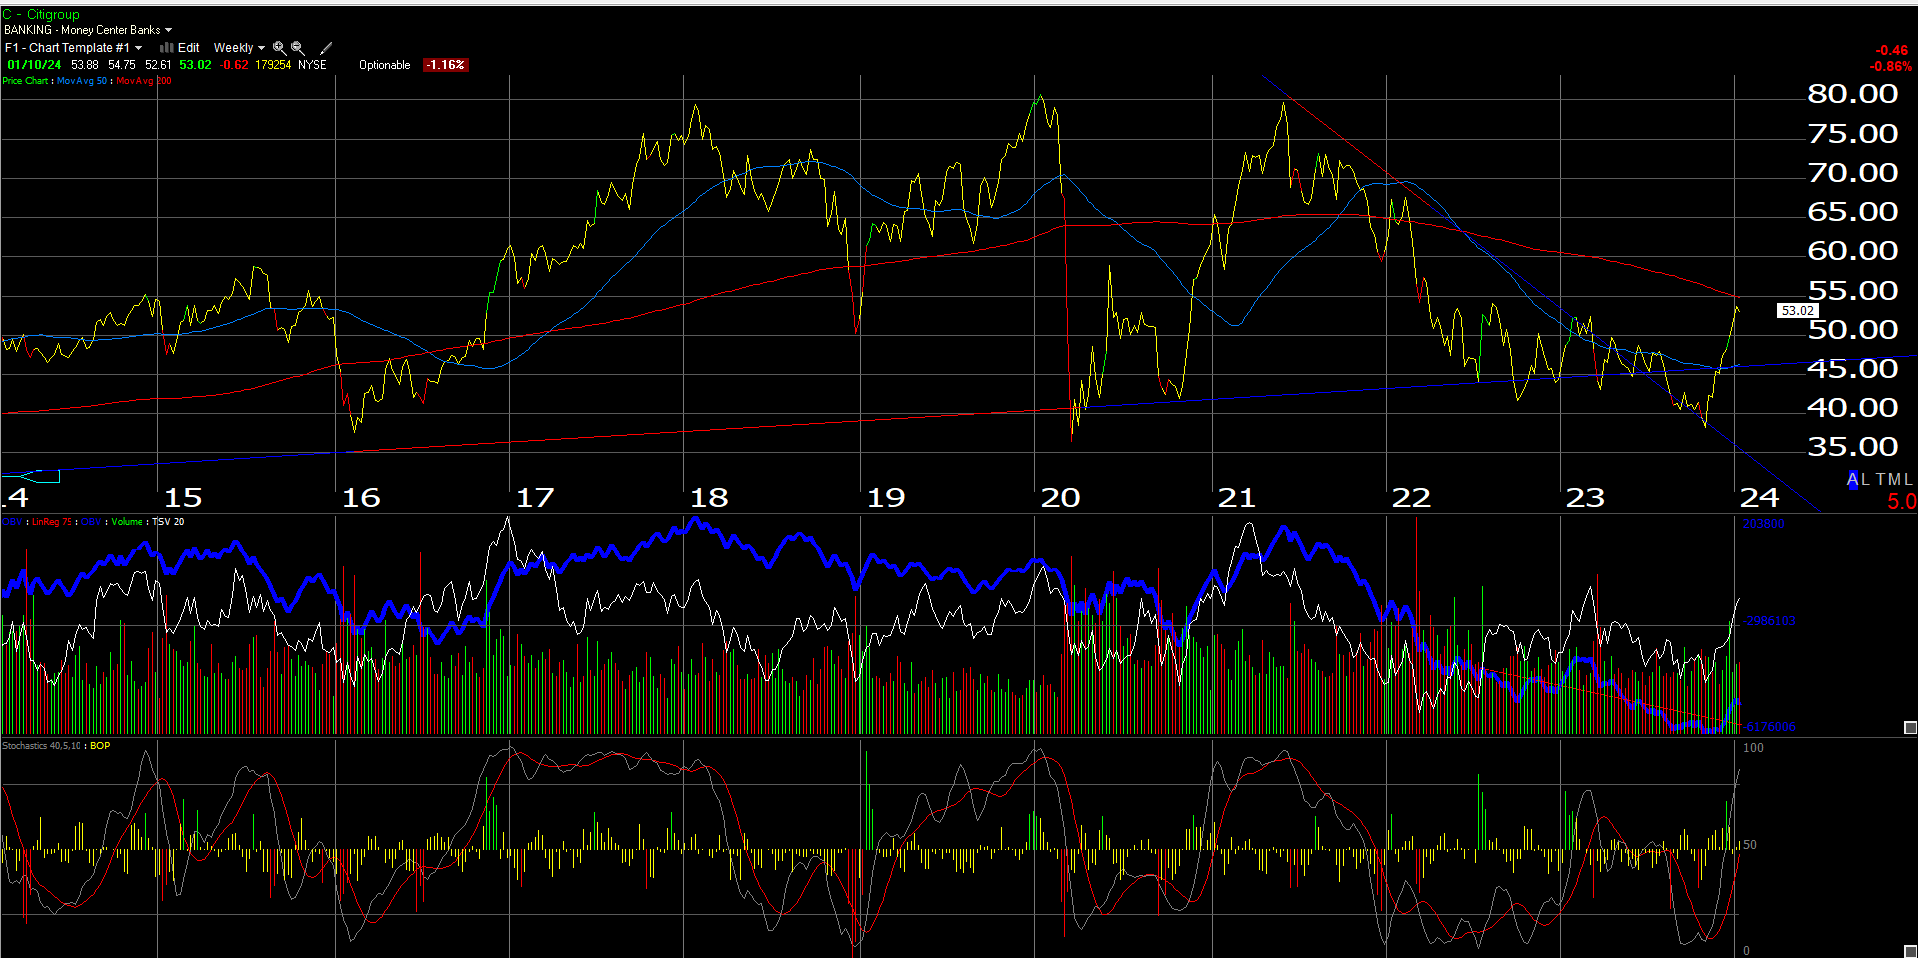
The only difference to the above pattern is that it’s taking over 2.5 years to start it’s move back up to $80 per share, although 2021’s bounce was greatly aided by ZIRP (zero interest rate policy) and the capital markets.
Basically, Mike is calling for the ball to bounce again, although a permanent improvement in fundamentals might help drive the increase, as opposed to temporary factors.
EPS and revenue estimate revisions:
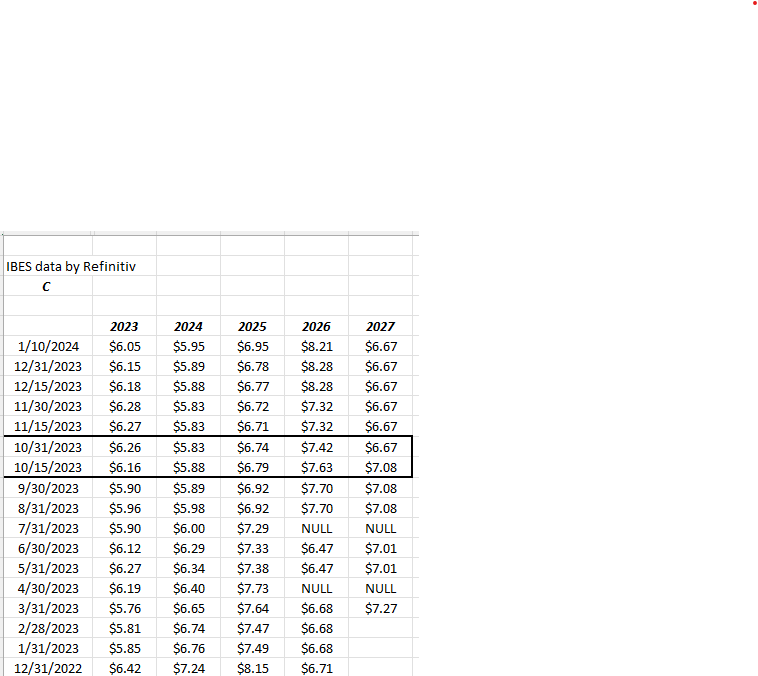
The Citi EPS estimate revisions showed an improvement after October ’23’s earnings were released, particularly for 2023, but have now settled back in December ’23, while 2024 and 2025 work higher.
Jane Fraser, Citi’s CEO, has already announced some payroll or staff downsizing, and also has announced that Citi will exit the municipal bond business, which will impact another 100 employees.
What nobody’s saying is that – at least according to my spreadsheet which shows the number of Citi employees every quarter, Citi had 240,000 full-time employees as of the end of Q3 ’23, which up 20,000 from the 220,000 at the end of September ’21.
Maybe Citi’s plan is simply to reduce the recent hires.
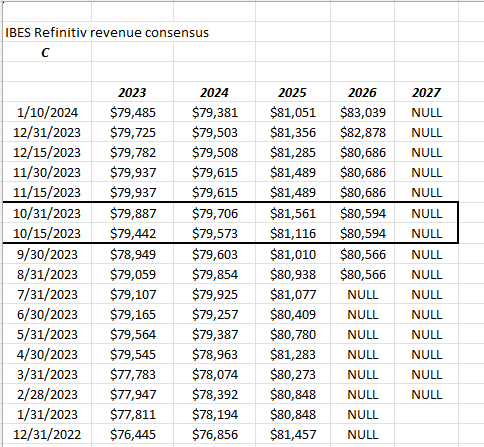
Citi revenue revisions have turned positive since earlier in ’23, but have slid back since the October ’23 earnings report.
Valuation: With the stock trading at just 9x ’23 earnings with a dividend yield just under 4%, (and the dividend hasn’t been increased since 2019), and a price-to-tangible book of 0.6x, the stock has looked cheap for years, but the well-below-average ROE of 7%, lags it’s peer group materially.
Revenue growth expected between ’24 and ’26 is just 1% average over the 3 year period.
Jane Fraser will likely be pressed to continue to improve ROE and ROA, without cutting bone.
Bank of America (BAC) Bank of America seemed to be hurt by less-than-robust net interest income in early ’23, not being able to capitalize on higher interest rates in either the investment or loan portfolios.
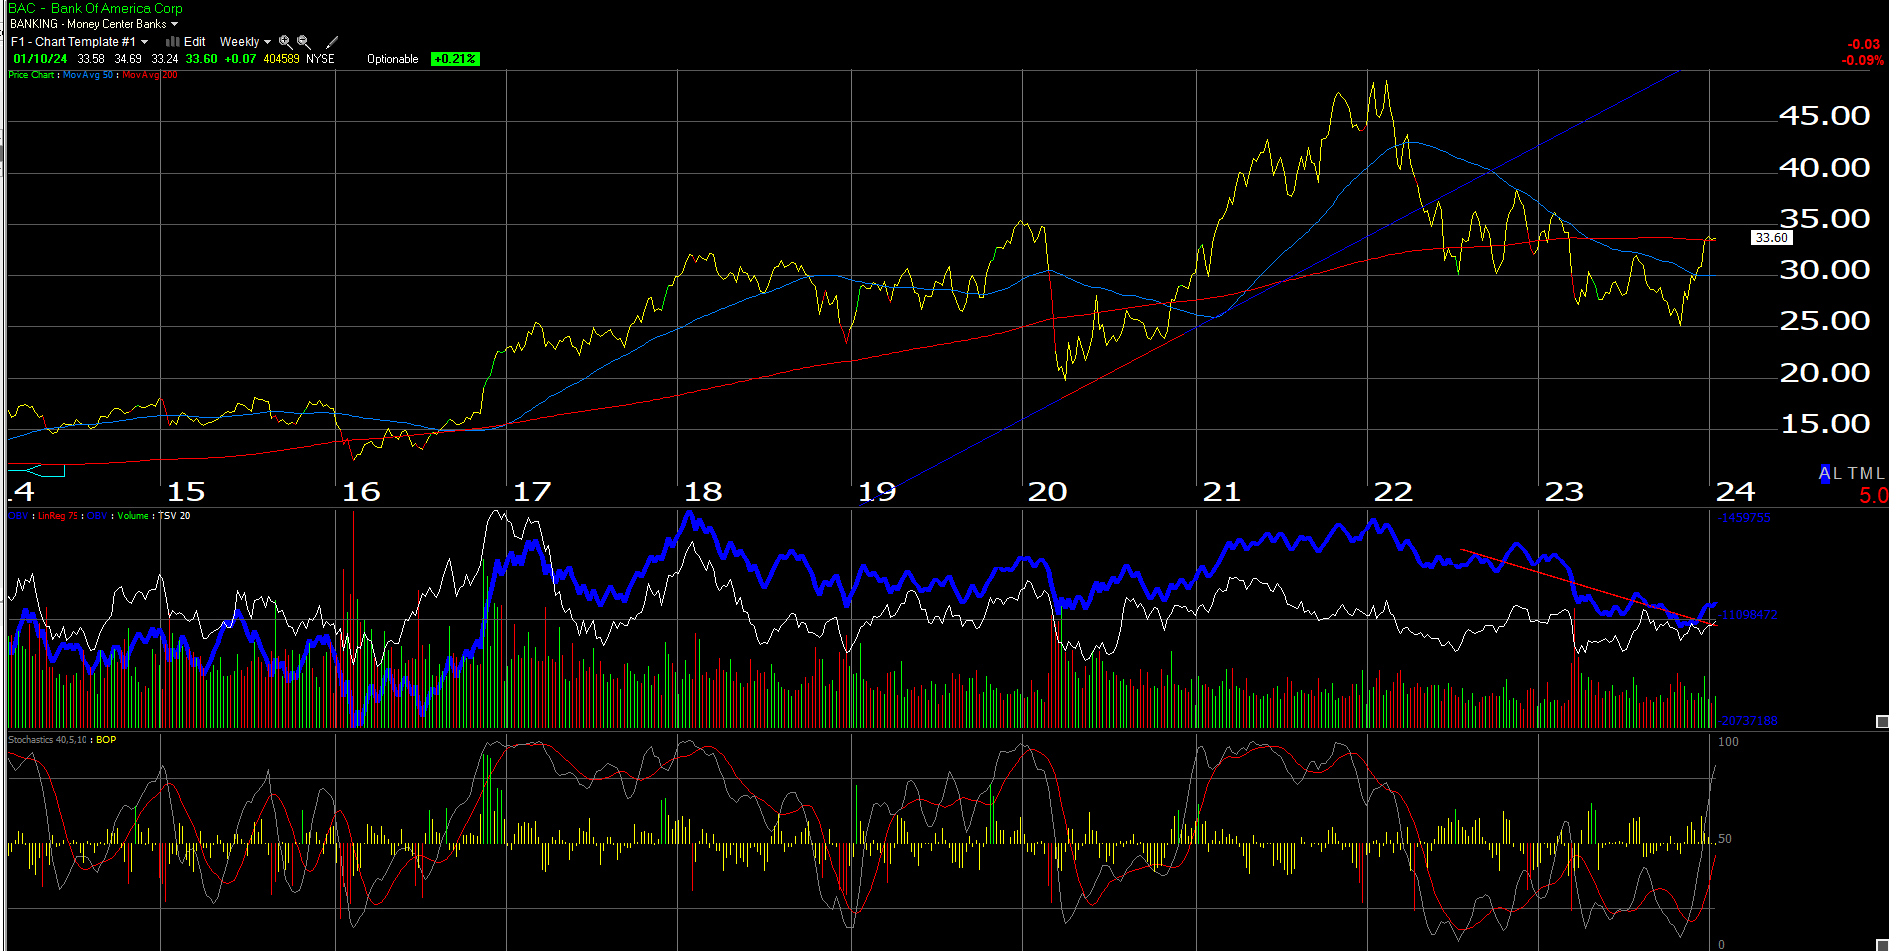
As the above weekly chart shows, BAC traded under the 50 and 200-week moving averages but has now climbed back above the 200-week moving average, very recently.
BAC EPS and revenue estimate revisions:
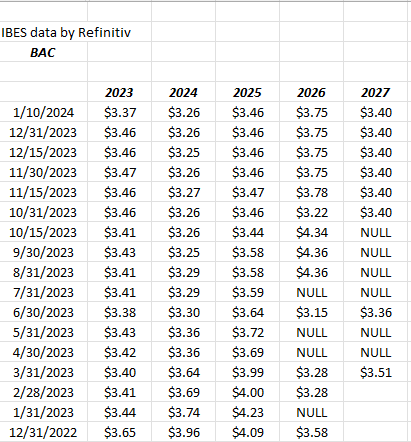
EPS estimates have been steadily lower since early ’23. Not very encouraging.
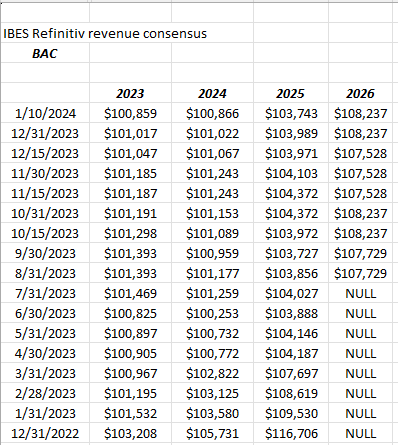
BAC revenue revisions have also seen a steady slide since late 2022, early 2023. These estimate revisions too are not very encouraging.
Valuation: BAC is expecting an “average” of 2% revenue growth and 3% EPS growth from 2024 to 2026 as the consensus estimates stand today today, which like the other banks, doesn’t look that great. Trading at 9x – 10x current earnings and at 1x book, and 1.2x tangible book, the valuation is hardly expensive, but all this makes sense with the expected growth.
Relative performance versus the SP 500:
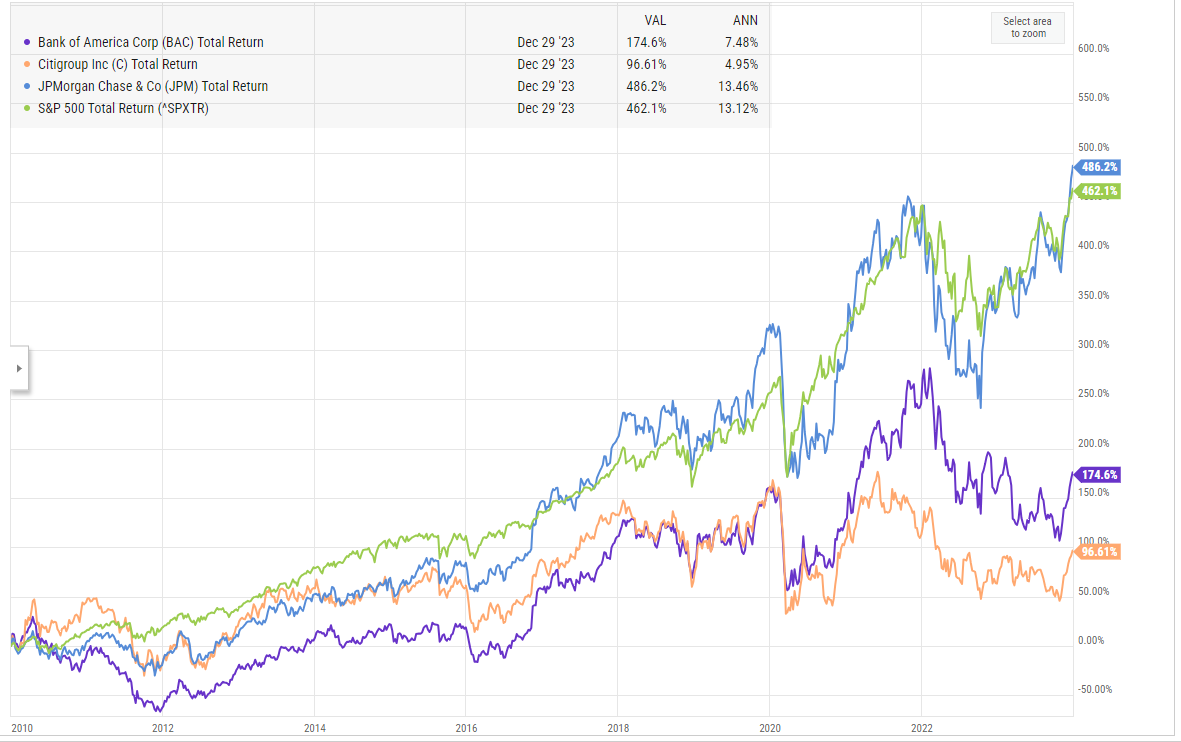
This graph shows JP Morgan, Citi and Bank of America, benchmarked against the SP 500, since 1/1/2010.
JP Morgan is the only stock of the 3 to beat the SP 500 in the last 13 years.
Summary:
Expected EPS growth: 2024 – 2026:
- JPM: -2% (go figure)
- BAC: 2%
- C: 11%
Expected revenue growth 2024 – 2026:
- JPM: -1% (again, it’s the math)
- BAC: 2%
- C: 1%
Current PE avg (2024 – 2026):
- JPM: 11x
- BAC: 10x
- C: 8x
Price-to-tangible book value:
- JPM: 1.80x
- BAC: 1.20x
- C: 0.60x
ROE / ROTCE:
- JPM: 15% – 17%
- BAC: 14%
- C: 6% – 7%
Mr. Buffett consistently sings Brian Moynihan’s praises (Bank of America CEO), but the stock has generated only half the return of JPM and the SP 500 since 1/1/2010.
For me, and it’s one opinion, JPM and C represent the perfect combination of “earnings growth” and “book value”. Clients are long some BAC but the stock seems to languish in both good and bad interest rate environments. Still, readers could remain long BAC and ultimately wait for the catalyst that moves the stock higher.
I do think all three stocks could win with a return to a normal yield curve (i.e. longer Treasury yields above shorter Treasury yields).
None of this is advice or a recommendation. These write-ups are done to clarify my own thinking and to insure I’ve gone through the discipline of running the numbers. Past performance is no guarantee or even suggestion of future results. Capital markets change quickly, for both the good and the bad. Beware of rotation. Readers should gauge their own comfort level with portfolio volatility and adjust accordingly. IBES data by Refinitiv is the source for EPS and revenue estimates.
Thanks for reading.