Just updated the spreadsheet for Apple this week, with latest EPS and revenue estimates. Like much of the large-cap tech universe, Apple has seen a correction in the stock since August 1 ’23, which was likely badly needed and wanted.
Here’s what the trend in revenue revisions looks like for the iPhone giant:
Fiscal ’25 (ends Sept. ’25):
- June ’23: $432.9 billion;
- March ’23: $440.8 billion;
- Dec ’23: $439 billion;
- Sept ’22: $446.5 billion;
- June ’22: $457.3 billion
Apple revenue estimates have been revised downward about 5% in the last year for fiscal ’25.
Fiscal ’24 (ends Sept. 24):
- June ’23: $407 billion
- March ’23: $415 billion;
- Dec ’23: $414.8 billion;
- Sept ’22: $428.8 billion;
- June ’22: $429.7 billion
Apple revenue have been revised downward about 5% for fiscal ’24 over the last 4 quarters.
Fiscal ’23 (ends Sept ’23):
- June ’22: $383 billon;
- March ’23: $387.9 billion;
- Dec ’22: $388.5 billion;
- Sept ’22: $406.9 billion;
- June ’22: $414.7 billion;
Fiscal ’23 Apple revenue has been revised lower about 8% in the last 4 quarters.
Summary: Apple’s iPhone and new product cycle dictates everything. This post isn’t meant to be a negative for the stock or the company; the sole purpose of the post was to show readers the revenue trends. Services now represents 26% of Apple’s total revenue, and is probably the reason the PE multiple is expanding on the stock, and cash-flow continues to improve. It’s interesting that after 20 years Morningstar just put a “wide-moat” rating on Apple, after nearly 20 years of phenomenal returns. I do think the iPhone and “hardware” reliance spooked the rating agency. With the growth in services, with an expected 70% operating margin, Morningstar probably felt it was time to stick a wide-moat classification on the stock.
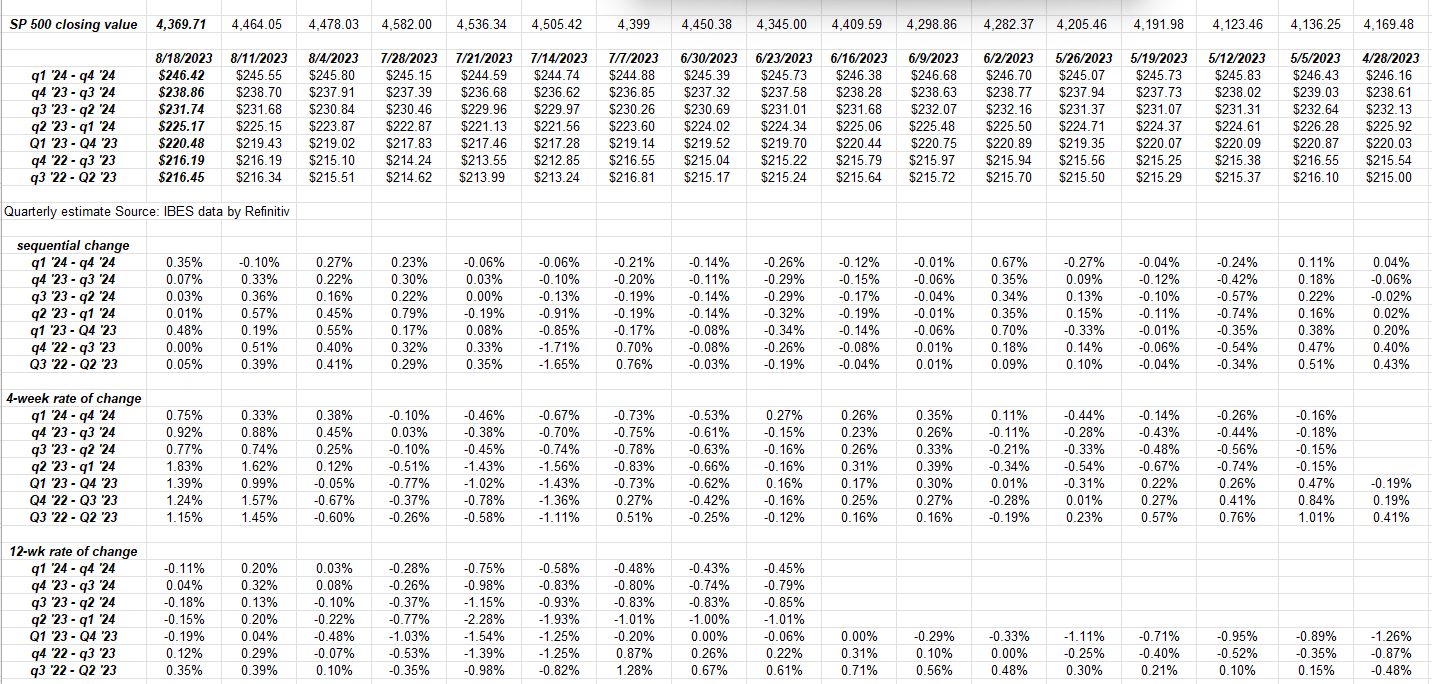
SP 500 earnings data:
- The forward 4-quarter estimate (FFQE) rose to $231.73, it’s 5th straight sequential increase (pretty unusual) versus the #231.67 last week, and the $224.01 on June 30 ’23.
- After anther 2% drawdown this week in the SP 500, the PE to end the week was 18.8x, versus last week’s 19.3x;
- The SP 500 “earnings yield” ended the week at 5.30% it’s 4th straight sequential increase, and above the June 30th and July 28, 5.03% prints;
- The Q2 ’23 bottom-up estimate ended the week at $54.20 versus the June 30 ’23 value of $52.98;
- The SP 500 EPS “upside surprise” is still +7.8% per the Refinitiv data, ahead of last quarter’s +6.8%. Revenue beat rates are +1.7% for the SP 500, a little less than Q1 ’23.
Rate-of-change data:
Readers may get a little confused looking at this data, but all that’s been done is to take the “forward 4-quarter estimate” and built it out each quarter from the current FFQE of Q3 ’23 through Q2 ’24,to show readers what the FFQE looks like if it were a Treasury yield curve.
The point is – looking ta the table below – since July 14 ’23 – the sequential, 4-week and 12-week “rates-of-change” continue to be revised higher, at least so far. That’s a plus for stocks, but with Walmart’s report this week, the next 6 weeks see fewer earnings and less likely less revision activity, thus it gives sell-side analysts more reason to be cautious and be more reluctant to raise estimates.
Data sourced from IBES data by Refinitiv
One more spreadsheet look:
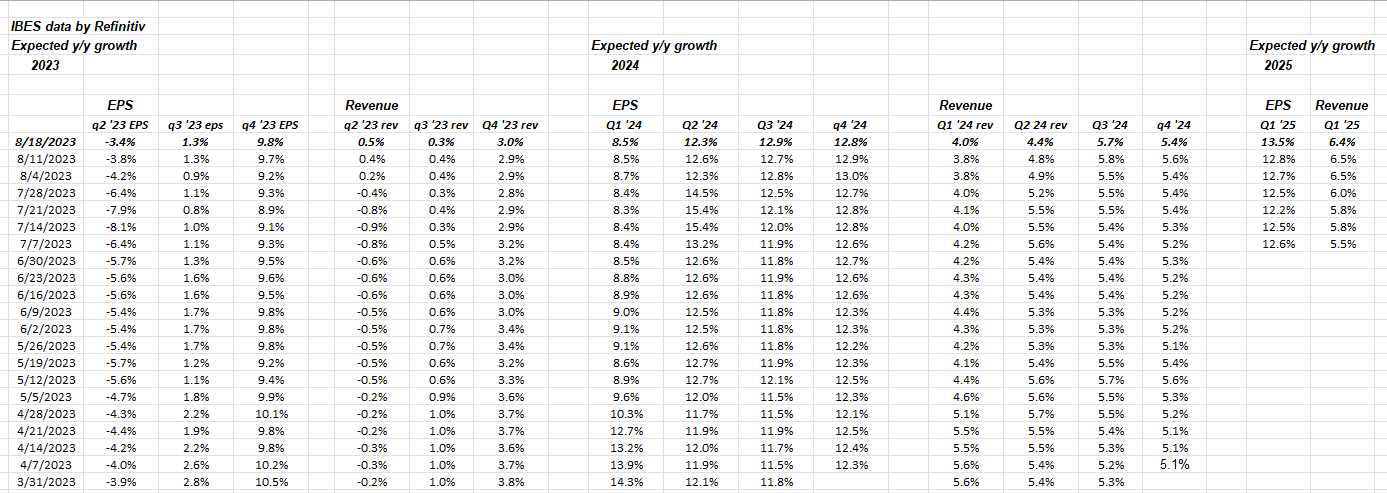
Note the improvement in the y.y growth rate for Q2 23 EPS.
Frankly, the numbers and revisions still look good for the 4th quarter of ’23, with Q3 ’23 and Q4 ’23 lapping easier comp’s from a year ago in 2022.
Summary / conclusion: August ’23 has been a typical-seasonal month for the SP 500 and the major equity indices as we’ve seen a mild pullback in stocks, particularly the mega-caps.
The 10-year Treasury yield is the only fly in the ointment right now as it hovers very close to a multi-year breakout above 4.33% – 4.35%.
While the cacophony is still yelling “inflation” etc. it seems like the merger moves in Treasury yields have correlated more closely with supply announcements.
Nvidia is the big earnings report this coming week (after the close on Wednesday, August 23rd, ’23), with consensus (per Briefing.com) expecting $2.08 in EPS versus $0.51 last year. No question Nvidia’s May ’23 earnings report which resulted in the stock jumping from a little over $300 to $400 in a day, started the AI frenzy that continues to this day. PaloAlto Networks (PANW) reported after the close on Friday, August 18th, 2023, which resulted in the stock trading up nicely in the after hours. Let’s see how PANW trades Monday.
The mega-caps and the tech sector needed a pullback after the first 7 months of ’23 returns, which we are seeing now.
With the SP 500 trading below it’s 50-day moving average, readers might be worried, but this last last chart (sourced from Bespoke) shows that a break of the 50-day moving average by the SP 500 isn’t typically a negative, UNLESS it’s accompanied by higher interest rates.
Note the forward returns.
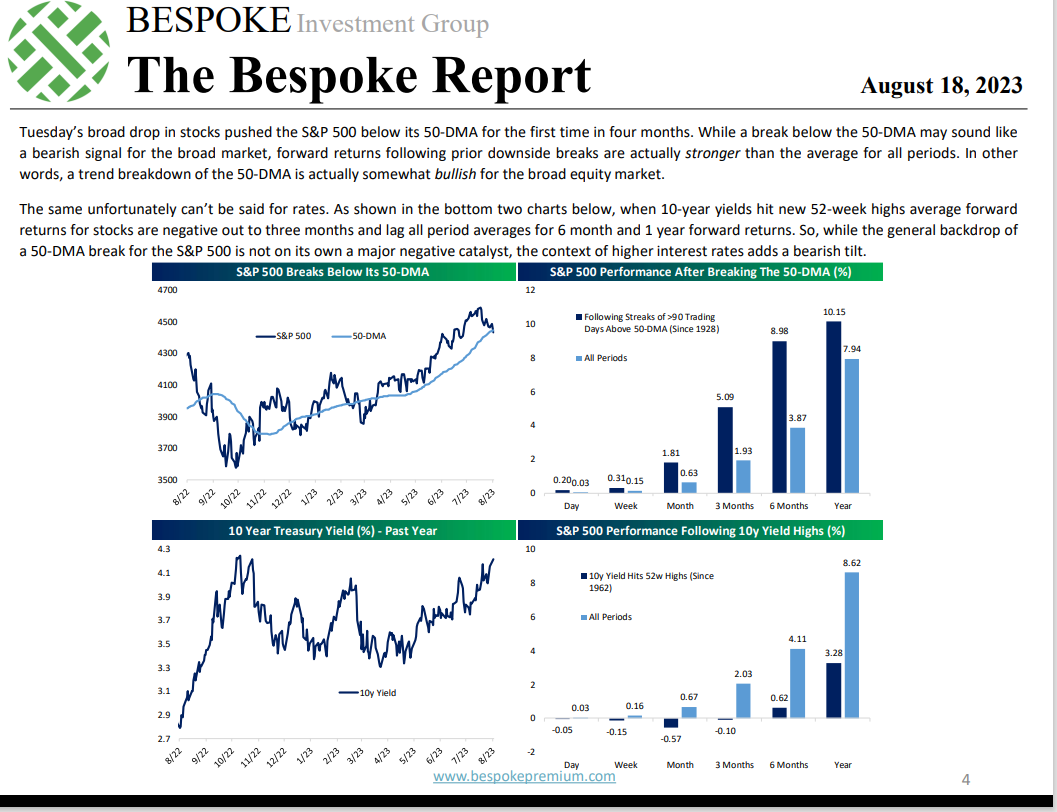
This is a good read. Watch that 10-year Treasury yield.
Take all of this as one man’s opinion and with considerable skepticism. Past performance is no guarantee of future results. Investing can involve the loss of principal. All SP 500 earnings data is sourced from IBES data by Refinitiv, but the tables, and spreadsheets are the work of the author, hence all mistakes or errors are my own. Capital markets can change quickly: readers should gauge their own comfort with market volatility and adjust their portfolios and investments accordingly.
Thanks for reading.