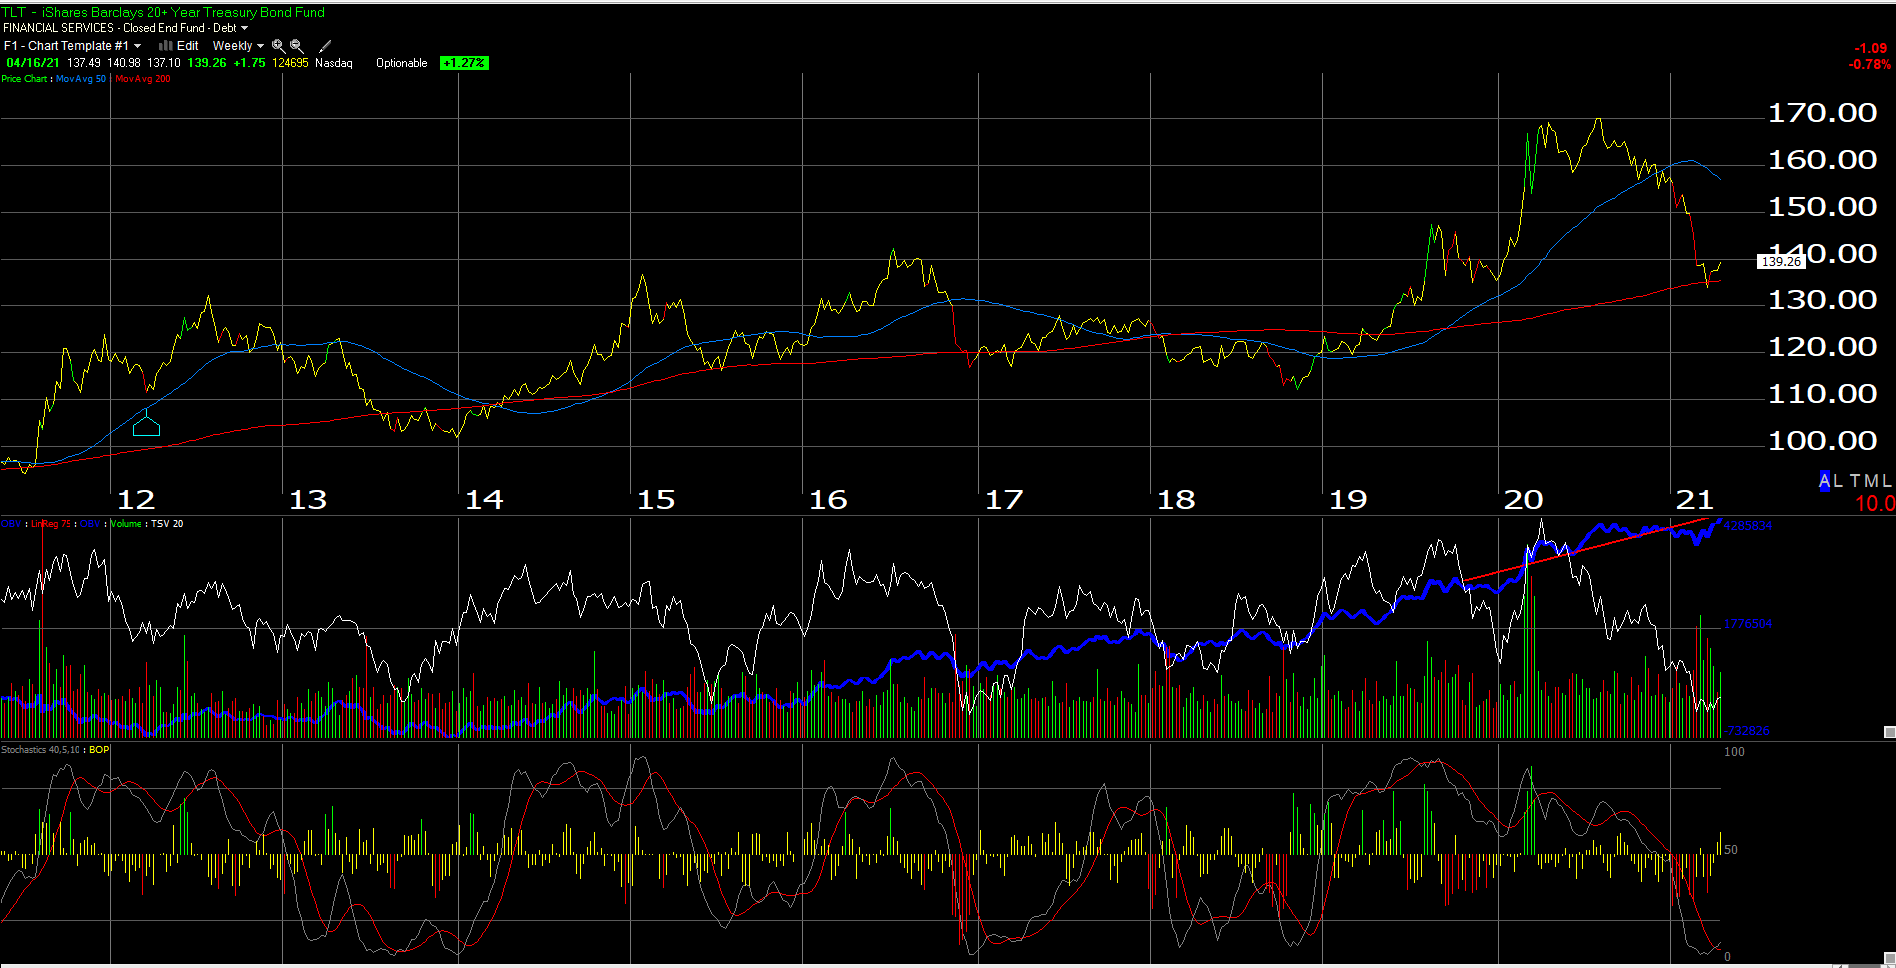
Chart source: Worden TC 2000 Gold
Click on and expand the above TLT chart (+20 year Treasury ETF) and you’ll see the ETF holding weekly support and if readers would look at the bottom third of the chart, you’ll see the ETF hasn’t been this “oversold” since September ’18 and early 2017.
There has been a lot of chatter on Twitter about interest rates and the fact that the 1.75% high water mark for the 10-year Treasury (post the 55 bp low yield in early August, ’20 around the Jackson Hole conference) hasn’t been exceeded despite the blow-out March nonfarm payroll report on April 2nd or Good Friday (the stock market was closed but the Treasury market was not closed that day) and subsequent strong or “above-expectations” economic data.
Have interest rates – particularly Treasury rates – peaked ? My old Money & Banking and Bond Management professor used to say the best interest rate forecasting tool was “i + 1 = i” or the best forecaster of tomorrow’s interest rate (i + 1) is the interest rate today (i). Some TLT has been added for clients simply because in the past I’ve liked to add to stocks or ETF’s testing 200-week chart support, but also being long the TLT is a good hedge against equity market weakness.
I’m not an “inflationista” but that doesn’t mean they are wrong. The PPI and CPI “comp’s don’t begin to get tougher until June – July ’21, meaning that the fixed weight inflation data doesn’t begin to see tougher “compares” until July – August ’21, so some of the inflation data could get stronger over the next few months. Also this discussion omits discussion of the PCE deflator which is the inflation indicator to which the Fed has historically paid attention.
Watch the Treasury market, the TLT, the 10-year Treasury yield (TNX) and the 1.75% level and the 30-year Treasury yield contract (TYX). (For chart watchers, the TNX and the TYX are the CBOE 10-year and 30-year Treasury yield contracts. )
Corporate High Yield (iShares HYG):
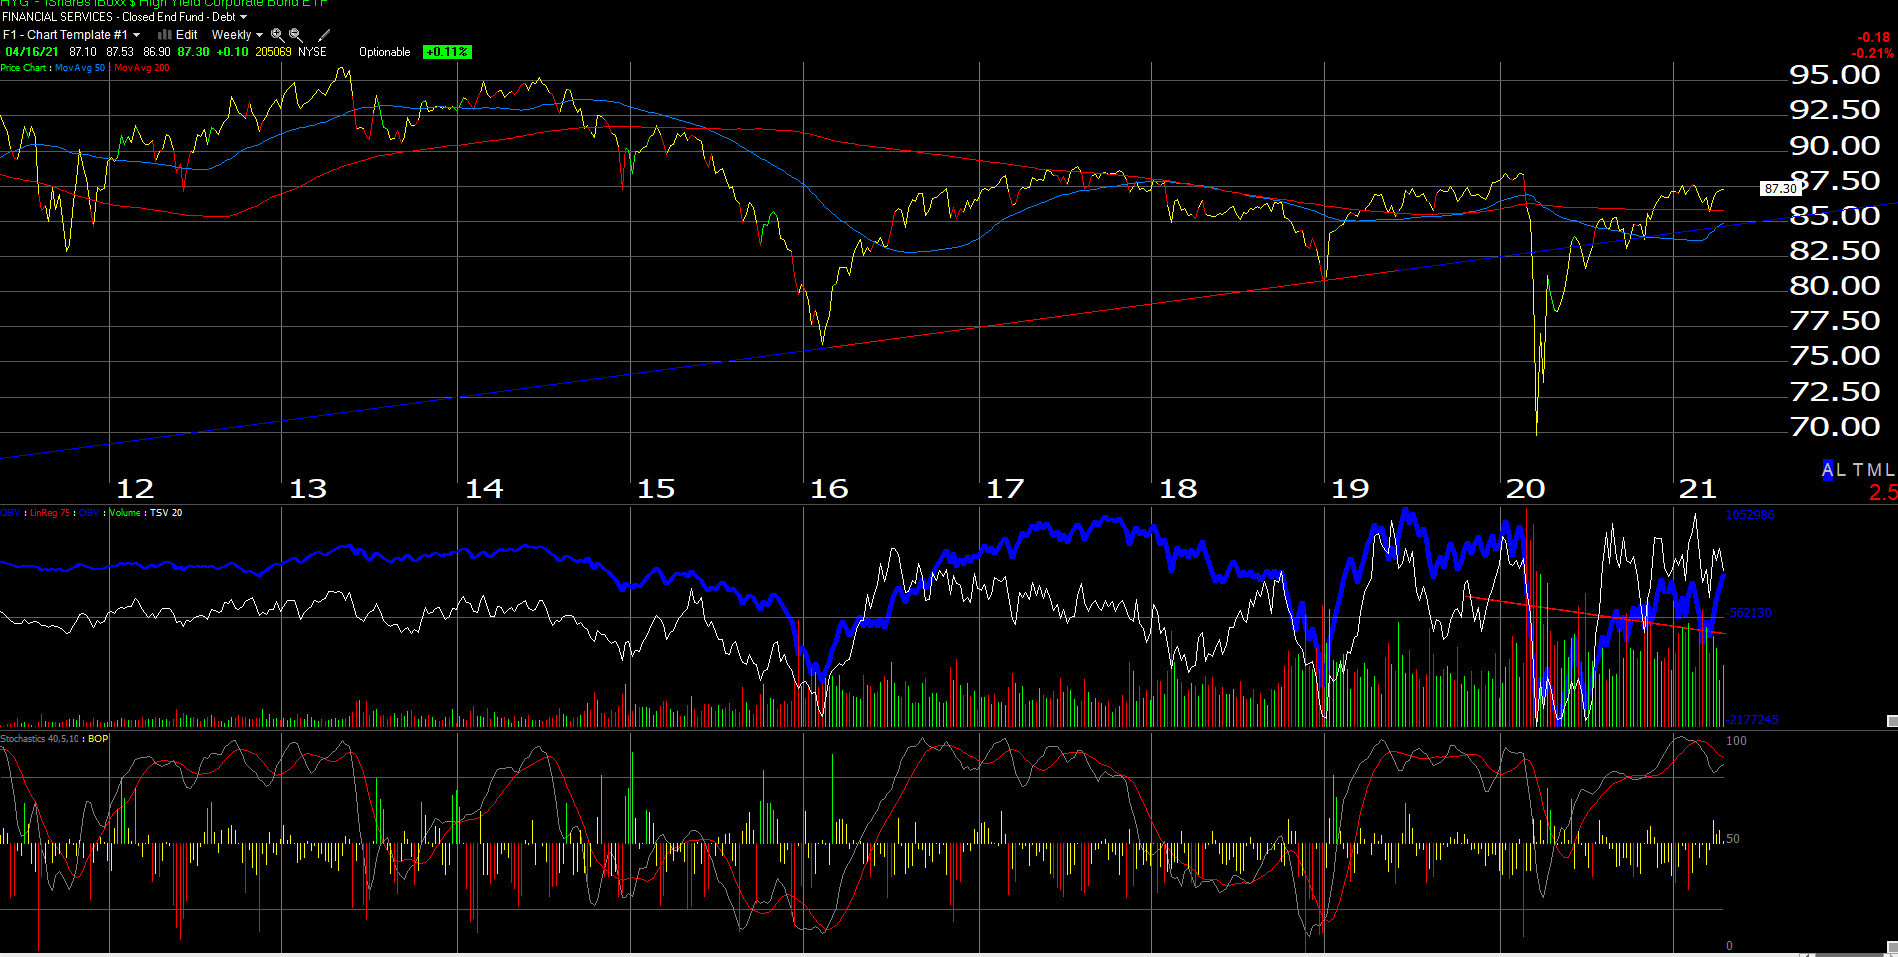
Chart source: Worden 2000 Gold
The HYG chart continues to trade above its 200-week moving average which is always a positive sign. The Fed’s liquidity programs programs put in place in late March – early April ’20 for credit market issues, to a great extent went unused for most of 2020 as just the mere public statements of Jay Powell and other Fed officials about providing enough liquidity to the capital and credit markets (i.e. moral suasion) did their job. The Bond Buyer ran an article last May ’20 listing all the various credit market and support lines the Fed provided after Covid-19 started and again, later in the year Rick Rieder of Blackrock noted that much of that available capacity wasn’t needed.
Short-term Corporate High-Yield (iShares SHYG):
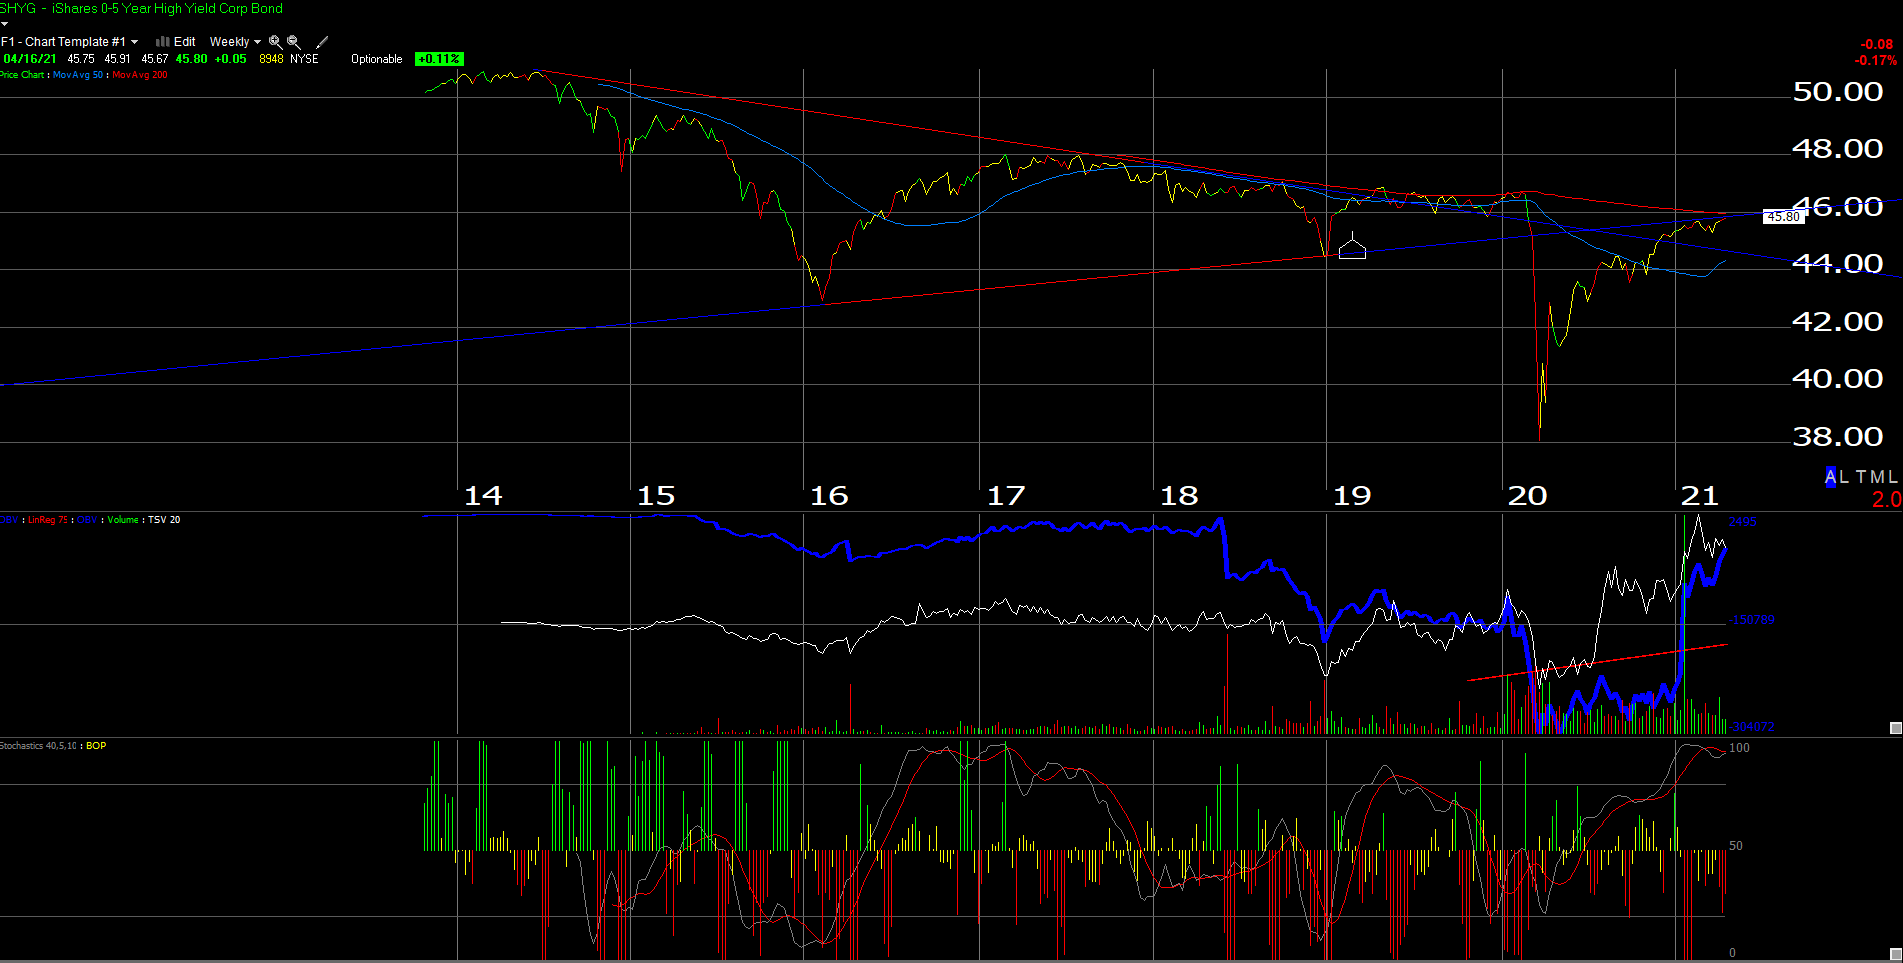
Chart source: Worden TC 2000 Gold
Here is the 0 – 5 year version of the HYG or the SHYG corporate high-yield ETF, which is less interest-rate sensitive and more geared to or sensitive to the “money-market” influence the Fed exercises (i.e. monetary policy) so the SHYG should be an early-warning indicator of Fed monetary policy more so than the HYG.
As the chart indicates $46 is a key level for the high-yield ETF. A trade above that $46 level on good volume is probably telling investors that the Fed’s talk about “not even thinking about thinking of raising the fed funds rate” is more reality than fiction.
Looking at the Morningstar data, the effective duration on HYG is 3.73 years while the same metric is 1.93 years for SHYG, but the SEC yield on the HYG is 3.56% while the same SEC yield on the SHYG is 3.32%, with the point being you get half the effective duration on SHYG than HYG, at almost the exact same yield.
A quick note for readers: Morningstar is noting that as of early May, 2021, they will NOT be updating the SHYG statistics or following the ETF any longer. It looks like the Morningstar coverage on HYG will be maintained. Since iShares is Blackrock, check the iShares website for relevant ETF information.
Summary / conclusion: The problem with corporate high-yield debt is that it tends to be correlated with US equity market direction, which makes perfect sense, given that the US equity market – when the secondary market for equity issuance is open and healthy – can be used to raise capital and payoff or refinance high-yield debt, with the point being that during an equity market correction, the high-yield ETF’s and funds are correcting with the stock market. During the Feb – March ’20 selloff, the HYG corrected (looking at the second chart (HYG), about 23% peak-to-trough), while the SHYG corrected about 17%.
With the overbought nature of the SP 500 in terms of sentiment (although SP 500 market breadth remains very healthy), clients are beginning to see some of their high-yield exposure reduced, and some TLT was added as well as some municipal high-yield (the two Nuveen open-ended high-yield mutual funds are used for clients). Being overweight corporate high-yield in clients accounts was not really a great intellectual stretch in 2020 given the massive Fed liquidity and the fiscal stimulus, but relative and absolute credit spreads are nearing 2007 levels (absolute yields are through 2007 levels I believe) so while retaining equity longs and sector and individual position weights, why push the envelope or the risk parameters by doing the same on the bond or credit side of portfolios.
The total return on the SP 500 as of 4/16/21 is 11.92%, and the “average, annual” return is 47.92%. Considering the 2-year SP 500 total return from 1/1/2019 to 12/31/20 was a cumulative 55%, think about the return rate the SP 500 has been appreciating at for 28 months.
A normal corporate high-yield allocation in client accounts if you look across model portfolios is roughly 10% – 15%. The clients that can handle that risk have been closer to 20% (or more) for most of 2020, but that overweight is now being reduced. With most macroeconomic and forecasting models expecting 6% GDP growth in 2021 (and some even higher) than that, there is a LOT of good news baked into corporate credit spreads. Although I dislike the term, you could call owning corporate high yield as an asset-class a “no-brainer’ the last year given all the Fed liquidity, but clients are now seeing their taxable high-yield weight being reduced.
Remember take any online or blog content with skepticism. Make your own investment decisions based on your own financial risk profile and your own emotional temperament for volatility and risk. Just because some asset class or security doesn’t look like “risk” today, doesn’t mean it won’t tomorrow. The shocking aspect to late 2008, is that even “money market” accounts – the Reserve Fund – looked like “risk” back then.
Thanks for reading.