With 466 of the SP 500 having reported 3rd quarter ’19 earnings, the earnings season officially ends this coming week when Cisco (CSCO) and Walmart (WMT) report their respective October ’19 quarters.
The big news this past week was the jump in the 10-year Treasury yield to close Friday, November 8th, 2019 at 1.93%. The 10-year Treasury has been trading above its 50-day moving average since October 10th, after trading below it since mid-November ’18.
We’ve been hearing about recession worries non-stop for 15 months, maybe the Treasury market is telling us this worry has passed.
SP 500 data (by the numbers):
- Fwd 4-qtr EPS: $172.90 vs $173.10 of last week
- PE ratio: 18x
- PEG ratio: 42x (interesting that this was 278 last week. We’ll see why in a minute.)
- SP 500 earnings yield: 5.59% this week versus the 5.64% last week
- Y/y growth of fwd est: just +0.42% vs last week’s +0.06% which is why the PEG narrowed this week. More in the summary.
- TTM est: $163.84 this week versus $163.59 last week
- PE ratio: 19x
- PEG ratio: 3x
- TTM SP 500 earnings yield: 5.30% vs last week’s 5.33%
- Fwd Est vs TTM est: 5.53% vs 5.81%
The last Decade:
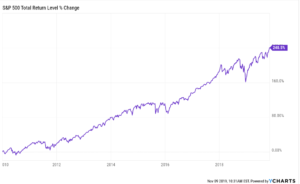
The value of the SP 500 on January 1, 2010 was 1,123.58. Here is a Ycharts graph of the SP 500’s return since January 1, 2010:
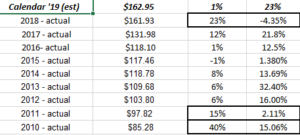
Source: internal spreadsheet
The middle column is the y/y SP 500 earnings growth, while the 4th column is the total return of the SP 500 in the respective year.
The 3rd columns sums to 111%, representing the cumulative growth in the SP 500 EPS for the last 10 years, while the SP 500 total return sums to 134% for the last 10 years. (The years highlighted in blocks represent years of “PE contraction”, where SP 500 earnings growth was greater than the total return for the benchmark for the year. )
The point being that SP 500 “P/E expansion” has not been as great as it was in the 1990’s, although this last decade has seen lower growth than the 1990’s.
Major changes in capital markets can occur as one decade rolls into the next: the 1980’s -1990’s bull market started in August ’82. The secular bull market ended in March, 2000. 2009 saw the end of what was the worst total decade return for the SP 500 since the 1930’s. I just wonder when it’s the Treasury market’s turn ?
Summary / conclusion: The +0.42% jump in the forward estimate (vs the same estimate 52 weeks prior) was the first sequential increase in the percentage growth since July 5th, 2019. Not sure we want to bet the farm on it, but changes in trend in forward estimates are just as important or even more important than absolute values.
Still, it’s just one week. Let’s see how the next few weeks unfold.
SP 500 earnings will dwindle for the next 6 weeks and then we start a new decade.
This last decade will likely mark the most hated bull market ever, as noted by these blog post’s here and here.
The SP 500 has seen three 20% corrections this decade (so far) although there is 6 weeks left in the year.
For 10 years SP 500 returns have been decent, and corrections rare but needed, when they do happen, and sentiment dour the whole time.
Thanks for reading.