We are presently in “the dead zone” of earnings reports and revisions, as – according to IBES by Refinitiv data – there were just 517 revisions to analyst estimates this week, versus the 2,300 odd changes to estimates during the usual peak week of the quarter, which in the 2nd quarter of 2018 was the week of May 3rd.
FedEx (FDX) and Micron Technology (MU) as well as Lennar (LEN) report this week, all on the same day – Tuesday, June 25th.
SP 500 Earnings data (by the numbers): Source: IBES by Refinitiv
- Fwd 4-qtr est: $170.74 vs vs last week’s $171.06
- PE ratio: 17.3x
- PEG ratio: 4.20x
- SP 500 earnings yield: 5.79% vs last week’s 5.93%
- Year-over-year growth of fwd est: 4.15% vs last week’s 4.32%
Has the 10-year Treasury Yield bottomed ?
The widow-maker trade since May 1 has been being short the TLT or being long the TBT (double inverse Treasury ETF) or TBF (inverse TReasury ETF) since the 10-year and 30-year Treasury yields have fallen from 2.51% and 2.92% respectively on May 1 ’19 to 2.07% and 2.59% today. While I think Treasuries and utilities are overcrowded and momentum trades today, it’s hard to fight the trend if the FOMC will reduce the fed funds rate in July ’19.
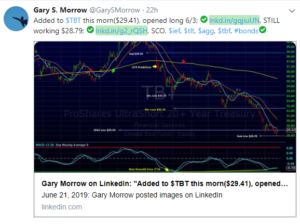
One of this blog’s favorite technicians, Gary Morrow, who writes for This Week on Wall Street, and posts his work to LinkedIn and Twitter (@GarySMorrow) as well flagged the potential reversal in the TBT this past week. Looking at the TYX chart, which is the CBOE 10-year Treasury yield contract (not price), the September, 2017 lows for the 10-year Treasury yield were 2.03%, while this week’s lows were 1.97%. Is there double-bottom in yields in place ? (Close enough for government work ?)
According to Bloomberg Barclay’s, the corporate high-yield asset class has returned 9.98% year-to-date. That’s good news and likely helping keep a bid under stock prices.
Summary / conclusion: There is a lot more to write about over the weekend, I hope there is time. However looking ahead a few weeks, when we roll into the new quarter on July 1, 2019, the “forward 4-quarter estimate” will roll from Q2 ’19 through Q1 ’20, to Q3 ’19 through Q2 ’20. Those current bottom-up estimates currently sum to $175.95, hence the headline for today’s earnings update.
Looking at the bottom-up estimates (and actual’s) for the SP 500, note the pattern for both 2018 and 2019:
2019 – estimates
- Q4 ’19: $44.40 – est
- Q3 ’19: $43.05 – est
- Q2 ’19: $40.46 -est
- Q1 ’19: $39.15 – will be “actual” next week, pretty close to final right now
2018 – actual
- Q4 ’18: $41.18
- Q3 ’18: $42.66
- Q2 ’18: $41.00
- Q1 ’18: $38.07
Q1 ’19 will final with a slightly positive year-over-year growth rate in SP 500 (expected at +1.6% currently) and Q2 ’19 should be slightly higher, but the easy “comp” comes with Q4 ’19 and beyond for SP 500 earnings. Note how the “compares” between 2019 and 2018 don’t begin to widen until the end of 2019.
Much will depend too on the G20 this week and what the additional tariffs mean for SP 500 earnings if President Trump and the trade team don’t hear what they want from President Xi and China.
I have yet to find any source that has fully quantified what full tariffs ($500 bl estimate to be levied ?) would mean for the SP 500 earnings watchers although the attached NY Times article raises the question but never answers. That is ultimately the risk coming into G20, and although the President will talk tough, it is expected he is going to give the Chinese every opportunity to comply.
Thanks for reading.