With 497 of the SP 500 having reported their Q4 ’18 earnings, attention has been focused on Q1 ’19 and full-year 2019 SP 500 earnings for a few weeks, and really since Wal-Mart reported since, the majority of companies have typically reported their quarterly news by the mid-point of February, May, August, and November of each year.
2,800 for the SP 500 seems to have this magical appeal since the SP 500 closed at exactly that level on Friday, March 22nd, 2019. Note the reference to 2,800 by Lawrence McDonald (@convertbond) in the earlier blog post from this week.
Even with the equity market distress on Friday, March 22nd, 2019, the HYG (high yield ETF) managed to stay above its 200-week moving average at $85.80 closing the week at $85.84. The key ETF is not yet above the 200-week average enough to say the corporate junk bond market is “all clear” but the ETF is not nearly as overbought as it was in mid-2017, when the effect of the rate hikes and lower yields started to force some selling.
SP 500 Weekly Earnings Data:
- Fwd 4-qtr est: $167.41 vs last week’s $167.77
- PE ratio: 16.7x
- PEG ratio: 6x
- SP 500 earnings yield: +5.98% vs last week’s +5.94%
- Year-over-year growth of fwd est: +2.8% vs last week’s +3%
(Source: IBES by Refinitiv)
What does the trend in Q1 ’19 SP 500 Earnings Look Like ?
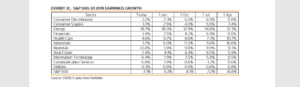
Look at the change in Energy’s expected Q1 ’19 sector earnings growth despite the fact that crude oil traded up to $60 again this week.
Here is the trend in expected y/y growth in SP 500 earnings for Q1 ’19 the last 4 weeks:
- 3/22/19: -1.7%
- 3/15/19: -1.5%
- 3/8/19: -1.3%
- 3/1/19: -1.1%
If the historical pattern holds, I would expect Q1 ’19 expected “growth” for SP 500 earnings to bottom over the next few weeks.
Measuring EPS revisions, SP 500 EPS revisions are gradually becoming less negative:
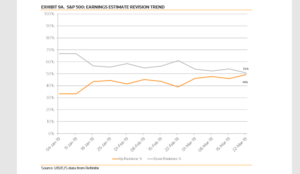
This graphs shows as a percentage of weekly revisions, upward revisions are back to approaching 50%. Whether this is the regular pattern for first quarter earnings we addressed in this blog last February ’19
or something else, will be known in a few weeks.
Analysis / conclusion: Despite the stock and bond market returns so far year-to-date for 2019, the only aspect to the market with reduced expectations is “expected” SP 500 earnings growth. Is the data accurate or has expected SP 500 earnings growth for 2019 of just +2.8% been revised too low ?
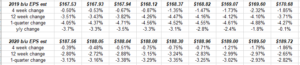
This snippet from our SP 500 earnings data spreadsheet shows the “rate of change” for SP 500 earnings for 2019 and 2020 the last weeks is – in fact – starting to slow.
Forward SP 500 estimates are becoming “less negative”. ( This is what was missed last October ’18 as was confessed to readers here.)
Looking at it from the bears perspective, even if SP 500 earnings grow 8% – 10% this year, from the current 2% – 3% estimate, with an SP 500 trading at 16x forward earnings, does that discount most of the earnings growth? Yes, it probably does.
My own opinion is that expected SP 500 earnings growth for 2019 is probably too low at 2.8% – 3%. However the SP 500’s 12% return for 2019 YTD discounts a lot of good news already.
I do think Q1 ’19 SP 500 earnings will matter for sectors like Financials and Tech since the flatter yield curve sent the Financial’s reeling this week.
Studying Money & Banking and Economics in the late 1970’s and early 1980’s, you learn much about bank revenue and “spread” lending and net interest margins, and the bank P/L’s. Those were the days when banks and thrifts (S&L’s) were crushed by the “disintermediation” of the late 1970’s. The money center banks and large brokers are so well diversified today, with revenue streams from asset management, credit cards, mortgage businesses, i was surprised at what seemed to be the indiscriminate selling of Financials this past week.
P/E expansion is a hallmark of secular bull markets. The March, 2000, top saw a P/E of 28x – 30x most of it derived from Tech and large-cap growth frenzies.
I do think China trade and Brexit, and more China trade than Brexit to see a meaningful push higher in the Sp 500.
This is one opinion, so please take it with a healthy dose of skepticism.
Thanks for reading.
More tomorrow.