Europe is weak, China seems to be weakening, trade and tariff issues have suddenly made everyone nervous even though the dollar amounts seem to have been reduced so does that mean Treasuries are poised for a decent rally here ?
My own opinion – and take it with a substantial grain of salt – is that the rally could already be over.
When the Italy election issues flared and Italian sovereign yields spiked, Treasuries rallied from 3.07% down to their current level and haven’t gotten much further south.
With retail sales this week coming in much stronger-than-expected this past week (including prior month’s revisions), the US having a 3.8% unemployment rate as of the last payroll report, and US GDP forecasts being raised for the 2nd quarter GDP, you would think Treasures would have reacted and they didn’t.
So we’ve had both bullish and bearish news (for Treasuries the last few weeks) and the US Treasury market has remained range bound.
Although he didn’t give the dates, CNBC’s Rick Santelli has been talking about this for a while. Looking at the weekly Treasury data I track here is what was found for trading ranges this year:
- 12/29/17 to 1/26/18: The 10-year Treasury yield (using the Friday weekly close) stayed within a range of 2.40% to 2.66%
- 2/2/18 to 4/13/18: the 10-year Treasury yield traded between 2.82% through 2.85% or 9 of the 11 weeks traded in the 2.80% range. 2 of those weeks saw closes of 2.75% – 2.77%.
- 4/20/18 to 6/15/18 Treasuries traded in the 2.90% range with the week of 5/18, seeing the 10-year Treasury yield close the week with a 3.05% – 3.06 handle.
Source: TNX CBOE 10-year Treasury “yield” contract, closing value as of Friday of each week
Let’s go to the charts:
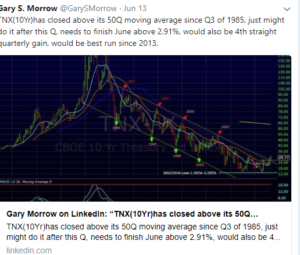
Interesting analysis from Gary Morrow, an excellent technician out if San Luis Obispo, Cal.
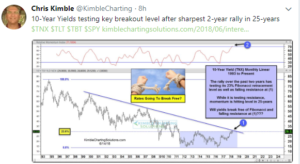
Chris Kimble out of Cincinnati, notes that the 10-year Treasury yield is seeing it’s fastest 2-year rally in 20 years.
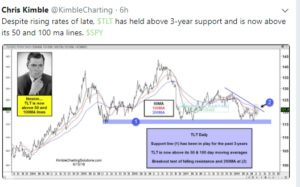
However, Chris Kimple also noted on Friday, June 15th that the TLT has held support. The chart looks ok,. Gary Morrow has written about the TLT in the past and said that the December ’16 and March ’17 lows of $116.50 are your line in the sand. The TLT closed over $120 this weekend.
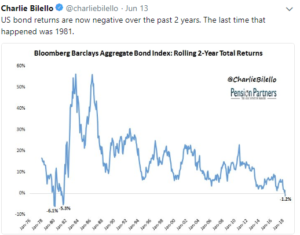
Finally, Charlie Bilello posted this week that US bond returns are now negative over 2 years, the first time that has happened since 1981. That’s actully bullish for the Treasury complex.
Conclusion:
When the SP 500 corrected in 2000 – 2002 by 50%, and there were three consecutive years of negative years, it was the first 50% correction for the benchmark since the 1973 – 1974 bear market.
The Treasury market rally of 40 years currently has a longer win streak.
I keep coming back to that 3.8% unemployment rate, and the JOLTS report that showed more job openings than the number of unemployed in America and creeping wage inflation.
However, bond market pain comes from changes in “inflation expectations” and so far the Treasury market is telling is that inflation just isn’t an issue.
The drop in crude oil on Friday, June 15th and the breaking of technical support for the crude complex likely means lower commodity inflation is ahead.
2.88% – 2.89% is the June ’18 lows for the 10-year Treasury.
With the exception of the technical’s and charts, the unfortunate aspect to this blog post is that it could have been written at any point in the last 10 years and been very wrong.
The inflation boogeyman has been warned about for a while, and just has not been an issue.
I’m still betting on a higher 10-year and 30-year Treasury yield this year though.
SP 500 earnings data out on Saturday, June 16th.
Again, thanks for reading.