Here is 6-year detail (both historical and prospective) of SP 500 earnings growth:
- 2020: +9% (est)
- 2019: +10% (est)
- 2018: +22% (est)
- 2017: +12%
- 2016: +1%
- 2015: -1%
Source: Thomson Reuters IBES
The Excel table just above shows the chronological progression of the SP 500’s forward earning’s (for calendar years 2018 – 2020) estimates since the tax reform bill was signed Friday, December 22nd, 2017 by President Trump.
It is the “growth rate” that is slowing, not the actual SP 500 earnings estimate.
If you look at the market corrections of 2000 – 2002, and then 2007 – 2008, the absolute level of SP 500 earnings fell for the index, showing negative earnings growth for those years, but unlike those two periods in the 2000’s, negative earnings growth doesn’t always mean negative returns for the SP 500.
During the 1980’s – 1990’s bull market, there were three years from 1990 to 1992 that saw negative SP 500 earnings growth for the SP 500:
- 1992: SP 500 earnings fell 12.5%, while the SP 500 returned 7.6%.
- 1991: SP 500 earnings fell 3% and the SP 500 returned 31% that year. Post Gulf War rally for stocks, falling interest rates, Technology and FInancial economy)
- 1990: SP 500 earnings fell 6%, and the SP 500 returned -3% in 1990 (First Gulf War, start of commercial real estate crisis)
So for a 3-year period from 1990 to 1992 when SP 500 earnings fell a cumulative 21%, the SP 500 returned 35% – 36%.
Conclusion:
Ray Dalio and Bridgewater Associates think 2019 could be ugly for financial assets and the bears are out there “bearing” (growling ?) in sympathy with Bridgewater.
The SP 500 bottomed in March ’09, and didn’t really make a new all-time-high until 2013, so you could in fact make a good case for the bull market still being fairly young.
As readers can see from the SP 500 earnings data, the reduction in the corporate income tax rate is driving some of the growth in SP 500 earnings this year, and it could potentially unlock a longer period of capital investment in the US economy as well.
The history of the 1980’s and 1990’s bull market in stocks was all about “P.E expansion” and market cap leadership, and the same holds true today. With a forward P.E of 17x today, the SP 500 is still trading well below the 1987 peak P.E before October ’87 and the similar P.E around the high 20’s in early 2000.
That being said – as was written a few weeks ago – dont just look at the SP 500 P.E ratio.
Tracking SP 500 earnings on weekly basis is a poor market-timing indicator. Readers who check the blog weekly to try and time the market are – with all due respect – playing a fool’s game, since the SP 500 will lead any change in estimates probably by 6 months or so.
Bridgewater could be very right about 2019 – but the fact too is this market hasnt seen even a decent correction since mid-2015 to Q1 ‘2016 when crude oil bottomed near $28 and high yield credit spreads widened substantially and before that was the 2011 20% SP 500 correction from May ’11 to early October, 2011.
Since 2013’s new all-time SP 500 high, this bull market has been marked with longer periods of stable capital markets and higher stock prices.
With Technology’s current 26% market cap weight in the SP 500 (and that doesn’t include Amazon and Netflix, both of which are part of the Consumer Discretionary sector), to have a problem with the SP 500, you’d have to have a longer-term problem with the Tech sector. With the Facebook and social media privacy issues earlier this year, Tech had a pretty good reason to break down and it didn’t.
Remember, Technology, Financial’s, Health Care and Consumer Discretionary (just 4 sectors) are over 60% of the SP 500 by market cap currently.
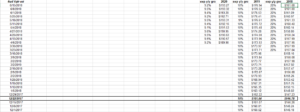
SP 500 Weekly Earnings Data:
- Fwd 4-qtr est: $163.97 vs last week’s $163.82
- P.E ratio: 17x
- PEG ratio: 0.78x
- SP 500 earnings yield: +5.90% vs last week’s 5.89%
- Year-over-year growth of fwd est: +21.77% vs 21.50%
The “forward estimate growth rate” (last bullet point) has been between 20% and 22% for 18 straight weeks, and the forward dollar EPS estimates for the SP 500 continue to drift higher.
Thanks for reading…