Supposedly, the old-school Sicilian Mafia have an old saying, “the snake lays coiled in Napoli” which supposedly means that in older Italy, when the Mafioso ran the country and the Mafia power centers were split between Sicily and Naples, the Naples faction liked to stir the pot and cause problems.
When looking across the various capital markets as we near 2018, I still can’t help but think “the snake lays coiled” in the Treasury market and the Treasury yield curve.
After 8 – 10 years of decent but below-average US economic growth, and a complete absence of inflation, if there will be a “disruptor” to the peace and quiet and across-the-board US stock and bond markets, I still think it comes from the US bond markets.
And that is an opinion that has been wrong for about 8 years.
1.) Here is a quick summary of the 2017 tax reform bill passed by Congress. The aspect that caught my eye was the 30% interest expense deduction limitation that presumably could impact the publicly-trade debt of US investment-grade and high-yield companies.
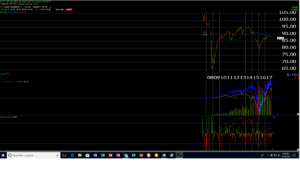
The above chart is the “monthly chart” of the HYG and is shows a clear rejection of the ETF at the monthly moving average. While i don’t have a strong opinion on the asset class since no high-yield debt is owned at present for clients, (which is probably an opinion in and of itself) the fact is that with all the forecasts for stronger US growth, stronger corporate earnings, and cash repatriation, you would think the US corporate high-yield bond market would be seeing a better bid, and it isn’t.
The JNK high-yield ETF looks similar.
For whatever reason, the US high-yield market looks like it is starting to weaken. Id love to own it lower for clients.
2.) 10-year and 30-year Treasury yields
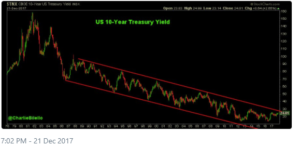
The above chart was cut-and-pasted from Charlie Billelo’s twitter feed. Charlie is an excellent technician with Pension Partners and regularly puts quality charts on Twitter for all see at @charliebillelo. If you arent following him you should be.
Charlie’s title of the tweet referenced the 30-year Treasury but his chart looks to be the 10-year Treasury yield, however like all charts that hit the media, the picture usually tells a good story.
If the 10-year Treasury yield breaks above 2.60% or the March ’17 highs, the next stop presumably is 3% or the late December ’13 highs, and the highest 10-year Treasury yield since the 2008 Financial Crisis.
3.) The Fed and the shrinking of the balance sheet:
Former Chairwoman Yellen noted that the $4.4 trillion Fed balance sheet, which started the 2007 recession at about $500 billion in assets would be reduced slowly over the next few years. Even with a slow rate of contraction, the Fed has said that of the yield curve remains flat, they would be a little more aggressive in shedding securities and if the yield curve steepened, they would let the securities runoff naturally, i.e. at maturity.
Analysis / conclusion:
While we have made up some of the performance differential on the equity side, the biggest miss the last few years on the fixed-income side of client accounts has been to underweight duration, underweight credit risk, and keep money in cash / money markets, and once the Fed began raising rates in late 2015, buy Treasury bills to start walking up the short end of the Treasury yield curve. We’ve also maintained a 5% – 10% long position in the unlevered inverse Treasury ETF given the historical low rates of the last few years and that too has been a drag on performance.
Are we finally on the cusp of a longer-lasting change in the bond markets ?
The last year of a larger negative return for the TLT was 2013, when the SP 500 rose 32%.
Here is the annual returns for the key Treasury ETF:
- 2012: +4.2%
- 2013: -12.2%
- 2014: +26.91%
- 2015: -2.87%
- 2016: +0.45%
- 2017: +6.92%
Whatever your politics, there is a lot of pro-growth economic stimulus coming into the US economy, some from tax reform, and some from the economic recovery around the world, including Europe.
Looking at the 10-year Treasury yield or TNX, the CBOE 10-year “yield contract” it looks like a double-bottom was put in July, 2012 and then again in mid-2016, around Brexit when the 10-year Treasury yield hit 1.39% and then 1.33%. (Chart not shown.)
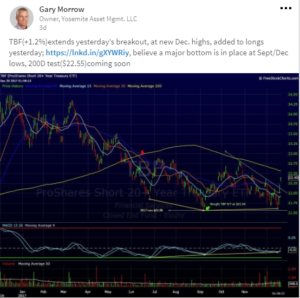
Gary Morrow, a long-time friend and very good technician who wrote for TheStreet for years, (@garysmorrow on Twitter) noted this past week, the TBF or the unlevered inverse Treasury ETF, looks to have found a solid bottom and looks to be headed higher.
Something is brewing in the bond markets, but it’s hard to know the end game. Does the 10-year rise to 3% again and then rally back from there ? Jeff Miller, the well-known blogger that writes “Weighing the Week Ahead” on Seeking Alpha, and an investment advisor with his own practice in the suburbs of Illinois, has told me in personal conversations that “there is just no inflation in the US economy” and he’s been exactly right.
For bond bears, or for those portfolio managers like myself who expected better economic growth and stronger stock prices to get reflected in the Treasury market, that has been the fly in the ointment the last 8 – 9 years.
There is no inflation, and no worry about inflation expectations changing.
This blog is looking for a tougher year in the bond markets in 2018. Higher interest rates, high-yield spreads that are too tight relative to historical spreads, a tax reform bill that discourages leverage, so the winds of change could be coming.
Again, take this blog post with a healthy degree of skepticism, since this been my forecast for a while. But the politics are lining up with the economy.
May every reader have a Merry Christmas, Happy Holidays, and a wonderful New Year.
Thanks for reading.