One of the reasons this blog started writing weekly about SP 500 earnings years ago, initially after the tech and growth bubble popped in the early 2000’s, was to see not just how SP 500 earnings actually correlated with SP 500 market peaks, and troughs, but to look at sector EPS and revenue growth estimates and how those growth rates change over time.
To put the conclusion out front, the fact is SP 500 earnings are mostly a coincident and even lagging indicator for market bottoms and tops, with the SP 500 benchmark index leading the change in SP 500 earnings. The other aspect is that readers and investors should differentiate between the “forward 4-quarter SP 500 EPS estimate” (which obviously looks 4 quarters ahead at any given point in time), and the bottom-up quarterly SP 500 EPS estimates, which are published by LSEG and Factset every week.
Crashes are always interesting and in this case I’m talking about the October, 1987, crash and the Covid-driven market collapse in March, 2000. SP 500 EPS estimates don’t have predictive effects over short periods of time.
- The October, 1987, market crash wasn’t as damaging as you’d think since the SP 500 ended up returning 5% in 1987, i.e. if investors didn’t panic, the SP 500 actually had a positive return for the calendar year. Granted, at one point I believe the Dow Jones 30 was up 30% as of July ’87, with the big slide occurring from the summer of ’87 through October 19th, 1987. While the SP 500 returned 5% in calendar ’87, SP 500 EPS fell just 5% in that calendar year. The post-mortem on the ’87 Crash was found to be the confluence of “portfolio insurance” and it’s influence on the SP 500 futures market (rather than anything specifically earnings-related at that time). In addition, the Michael Milken-founded high-yield corporate bond market, which didn’t exist prior to the early 1980’s, was starting to see liquidity problems, which ended with the failure of the United Airlines high yield bond issue sometime in the 2nd half of 1988 (if memory serves correctly). Finally, from early 1988 the US banking system was starting to feel the impact of the commercial-mortgage or CMBS crisis, which lasted into the early 1990’s. The Reagan Omnibus Budget Act of 1986 removed the “passive loss” income feature on real estate, which apparently drove a considerable amount of “non-economic” commercial real estate construction in the early to mid-1980’s, a lot of which found its way onto bank and financial service companies balance sheets. The Resolution Trust Corporation (RTC) was enabled by Congress to remove much of this debt. The change in the banking laws and the steep yield curve led to an explosion of REIT issuance after the start of Gulf War I in January, 1991. This one change in the banking laws in 1986 eventually turned the REIT and commercial-real-estate business from primarily private, deal-driven, bank financing to an explosion of public equity and debt issuance in the 1990’s. For readers, the fascinating aspect about the banking crisis from 1988 through 1993, was that far more banks and savings and loans failed during this period, than failed during the “great financial crisis” in 2008.
The point being while the October ’87 Crash seemed like a “futures market” issue, in fact there was a lot happening economically in the background and SP 500 earnings weren’t impacted that much.
More importantly though, even if you had bought the SP 500 and Dow market highs in the summer of 1987, you recovered those all-time-highs and had a positive return after just 24 months. SP 500 EPS actually grew 15% y-o-y in 1988, and the SP 500 returned 16.61%.
- Covid drop of March, 2020: with the lock-down of America, forcing Americans to stay home-bound, the March, 2020, drop was 33.9% over just a 4-week period. This blog was doing the weekly SP 500 earnings update, and here’s how the numbers play out:
- 1.) The forward 4-quarter estimate for the SP 500 peaked in late January ’20 at $176.76, while the SP 500 index peaked in late February ’20 at 3,386.10.
- 2.) The SP 500 made a new all-time-high in late August, 2020, while a new all-time-high in the forward 4-quarter estimate wasn’t made until April, 2021, or 9 months later.
Did the SP 500 forward EPS number “predict” (by one month) the drop in the SP 500 in March, 2020 ? It’s probably a stretch to make that call with conviction, given the quarter-to-quarter noise in the SP 500 forward estimate, but this is one instance where you could say the SP 500 forward estimate was a coincident indicator for the benchmark index.
The 2000 to 2009 historic bear market for the SP 500:
The real statistic that matters with the SP 500 peaking in March, 2000, is that it never made a new, and persistent all-time-high until May, 2013. The Nasdaq 100, which also peaked in the March, 2000, time frame, also never made a new and persistent all-time-high until 2017.
If an investor bought the March, 2000, peak in the SP 500, you had about 1 week on October, 2007, where you could get out at breakeven or even a small gain, but if you didn’t sell in the last two weeks of October, 2007, you rode the SP 500 down another 50%, to the March 9th, 2009 lows of 667.
2000 to 2003:
Here’s what SP 500 earnings looked like in the late 1990’s, early 2000’s:
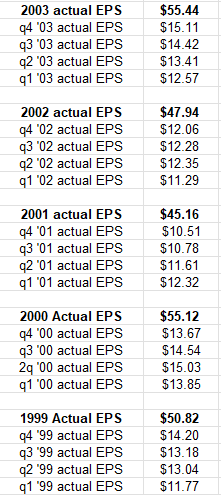
Even though the SP 500 and Nasdaq 100 peaked in March, 2000, SP 500 EPS continued to grow and finished the year with a 10% – 11% earnings gain, although the SP 500 fell 9% in calendar year 2000.
It was Q1, 2001 when the SP 500’s and the Nasdaq real damage started, beginning with Cisco’s warning in 2001, which send the Nasdaq 100 down -22% for the quarter, while the SP 500 fell -11.86% in 3 months.
Intel warned in September, 2000, but Intel had warned before during the 1990’s. The real market damage came from Cisco.
The SP 500 peaked in March, 2000, while quarterly SP 500 EPS peaked in Q2 ‘2000, even though the full-year EPS print of $55.12 was the highest annual print for the bull market from 1982 to 2000.
The SP 500 bottomed in March, 2003, shortly before the 2nd Iraq War under Bush 44, right around 778 – 780, and that was again coincident with the bottom in the quarterly EPS in 2003 for the SP 500 in the spreadsheet table above.
October, 2007 to March, 2009:
The SP 500 peaked in the October, 2007, trading a little higher than the March, 2000 high print for a week or so, but the SP 500 ultimately succumbed to the looming mortgage crisis which had begun to show it’s horns with the Bear Stearns CLO hedge fund collapse in August, 2007.
The interesting data point for me was that the “forward 4-quarter SP 500 EPS estimate” didn’t peak until July, 2008, sometime between the 3rd and 4th week of July in 2008, and then it rolled over rapidly, which was 9 – 10 months after the SP 500 peaked in October, 2007, and about 6 – 7 weeks prior to Lehman’s collapse.
The SP 500 bottomed at 667 on March 9th, 2009, but the forward 4-quarter estimate did not finally turn higher until mid to late May, 2009.
Summary / conclusion: The first rule taught in investing / valuation classes is that “the stock market” is a discounting mechanism, and is typically ahead of major market bottoms and tops. Using bottom-up quarterly SP 500 estimates, investors know only in hindsight, when SP 500 earnings bottomed. The forward 4-quarter SP 500 EPS estimate you’d think would be a better gauge given it’s forward-looking but the FFQE lagged the top in 2007 by 9 -10 months, and then lagged the bottom by 2 – 3 months in the Spring of ’09.
There is a way to use the LSEG and Factset SP 500 earnings data effectively (in my opinion) but that will be the subject of a future blog post, and it won’t be from a “market-timing” perspective. (This blog prefers LSEG because it gives a wider sector data set from different time perspectives than Factset, although this blog has never been a Factset subscriber. Ed Yardeni is the “dean” of SP 500 earnings watchers published a lot of data on the topic on his blog, which you can subscribe to at a price. He’s quite good and his data goes back decades.)
It’s a commonly-held fact given all the headlines that SP 500 earnings are quite robust today, given the “upside surprise” factor for both SP 500 EPS and revenue at +10.3%, and +2.3% respectively. 2023 and 2024 were dominated by Nvidia and AI as the SP 500 rose 25% each year, but the 2025 rally is much broader with more sectors participating, like financials, industrials and utilities. Personally, I think a lot of that is due to the 2024 Presidential election results and the “pro-business” environment that emerged. The “robustness” of SP 500 earnings and revenue is unusual as we near the end of calendar 2025, so readers might plan for a day when the SP 500 EPS and revenue growth is less robust and less broader than it is today.
Readers should NOT use the SP 500 earnings data to try and time markets. Readers and investors should not try and time stock or bond markets to begin with, but more importantly shouldn’t use the macro earnings data as a method of moving in and out of the stock market.
None of this is advice or a recommendation, but only an opinion. Past performance is no guarantee of future results. Although the intent is to do a follow-up post on this topic none of this information may be updated, and if updated may not be done in a timely fashion. Almost all of this blog’s SP 500 earnings and revenue data is sourced from LSEG, but occasionally some Factset data is used, where it is sourced separately.
Thanks for reading.