Since this blog post, the 10-year Treasury yield has fallen, which has put the TLT (below) close to breaking its downtrend line (price, not yield) in place since early 2015.
Not being a trained technician and more an armchair observer, does this chart represent a head-and-shoulders pattern ?
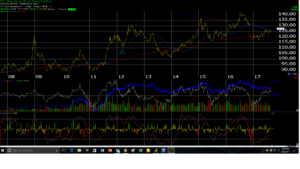
Either way, it looks like the TLT is poised to break above this downtrend line.
Great (sarcasm).
The chart of the Transports has been on the verge of breaking down for a few weeks now, but the bond market and particularly Treasuries have frustrated for years.
Owning high yield or investment-grade credit looks to be a poor risk-reward.
With the hike in the fed funds rate to 1% – 1.25%, clients own Treasury bills and money markets now, and little duration or credit risk.
To be frank with readers, this call has been wrong for many years. Inflation seems non-existent.
Last week, with the Thursday morning jobless claims release showing just 232,000 in initial jobless claims, and near multi-year lows, the Treasury market didn’t budge.
Transport’s have been close to a technical breakdown for many weeks.
Another rally in the 10-year Treasury yield through 2.13% and a breakout in the TLT would not be well received in the equity market in my opinion.
Thanks for reading…