If only one blog post was done once a month for readers, updating “annual” or “average, annual” returns for the SP 500 and other benchmarks would be it.
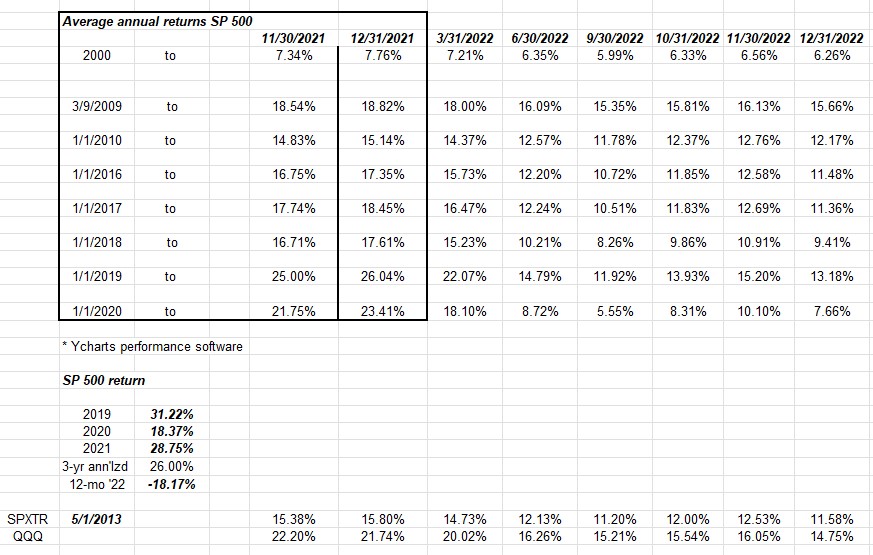
If readers would look at the top half of the spreadsheet, it could be seen how 2022’s -18% total return for the SP 500 has gradually brought down the annual returns for the key benchmark, each quarter.
As was written about recently in this blog post, we (as investors) needed a year like 2022 to “reset” the longer-term returns to a more reasonable level.
Another data point possibly more interesting than the SP 500’s annual returns is the bottom two lines of the above spreadsheet showing the SP 500’s annual return from the point at which the SP 500 finally broke above the March, 2000 high.
The last line was added this weekend. What I didn’t realize is that even though the SP 500 broke above it’s March, 2000, high in early May, 2013, it wasn’t until late 2015, that the QQQ’s broke above their March 2000 highs, meaning that the Nasdaq and specifically the Nasdaq 100, spent 13 years under water, after peaking in March, 2000.
This also means that – for the Nasdaq 100 – this new bull market is just 7 years old.
You don’t hear that much today.
Fixed-income asset class current yield update:
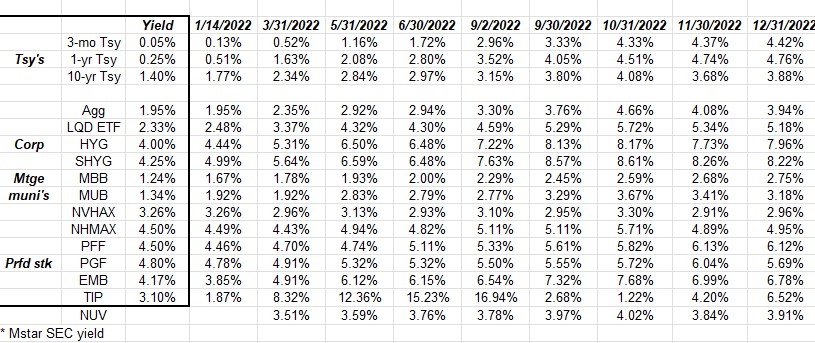
This spreadsheet was started a year ago to capture changes in yield across various fixed-income asset class and mutual funds.
There is no question, the bond market is far more attractive from a yield and expected total return perspective, than just a year ago.
Looked at another way, i.e. looking at “annual returns” for various bond asset classes: 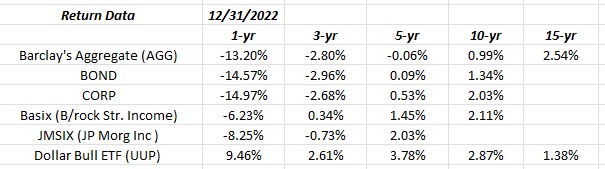
Why I threw the dollar in there (i.e. the UUP) i have no idea, but looking at the Barclay’s AGG and two PIMCO corporate bond ETF’s, and then two of client’s largest bond positions to end 2022, readers can see that the 10 and 15-year annual returns are barely 2% today, which is a problem given how slowly inflation is receding.
My apologies – this list is hardly comprehensive and it will be expanded the next time it’s the topic of an article.
Treasuries were crunched in the last half of December ’22:

Treasuries were run over the last 2 weeks of the year, which could have accounted for the weak equity markets in the 2nd half of December, 2022.
The 10-year Treasury rose 40 basis points from 4.38% to 4.88% the last two weeks of 2022.
Ouch…
For the month of December ’22 though, the 10-year Treasury yield rose just 18 basis points.
Summary / conclusion: Since the SP 500 didn’t permanently take out it’s March, 2000, high until May, 2013, and the Nasdaq 100 didn’t permanently trade above it’s March, 2000, high until later in 2015, a reasonable case could be made that the secular bull market in the SP 500 is just 9 years old, and the Nasdaq bull is just 7 years old.
However, as the old saying goes, there are lies, damned lies, and then there are statistics.
The jobs report this coming week and inflation data could keep the Fed and Powell in a tight spot for the next few months.
The fact is the services economy is still humming.
Take this all with great skepticism, and past performance is no guarantee of future results. I had breakfast last week with a bond fund manager at a mutual fund firm where I was an analyst in the early 1990’s (until ’95) and he’s been running bond money for 30 years and he thought the SP 500 has one more flush ahead of it, before the “bear” would be done.
It’s one opinion, but it’s a highly-valued one. The thing is corporate credit spreads are still behaving well.
Thanks for reading. Back with more before the holiday weekend is done.