Led Zeppelin’s great tune notwithstanding, the SP 500 earnings patterns for Q3, Q4 ’20 and into early 2021 remain positive.
The “forward 4 -quarter” estimate actually rose for the third week in a row this week, when in normal times (although nothing is really normal about 2020) there is typically a slow, downward drift into the coming quarter.
- This week: $143.79
- Last week: $143.25
- 2 weeks ago: $142.98
That’s just one metric but it tells us that the heavy downward pressure after late March ’20 on forward estimates was likely too severe and now the Street is pulling up their forward numbers, albeit slowly.
The 2021 estimate this week came in at $163.31, the 7th straight week of that number winding up in the “$163” area and it looks to be stabilizing. Some put little weight on the 2021 number, but I wanted to point the trend out to readers. The 2021 Sp 500 EPS estimate remains above 2019’s actual EPS of $162.93.
The Forward Earnings Curve:
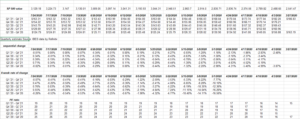
Refinitiv published the quarterly and annual EPS data for both historical quarters and the forward estimates, so this table simply sums the quarterly bottom-up estimates for the SP 500 and then shows the bucket as something resembling a forward earnings curve for the SP 500.
Note the rates of change for both sequential and weekly periods.
For the 7/21/20 period, look at the belly of the SP 500 earnings curve: while getting “less negative” the last 8 weeks, the revisions are now positive the last two weeks.
Q3 & Q4 ’20 specifically:
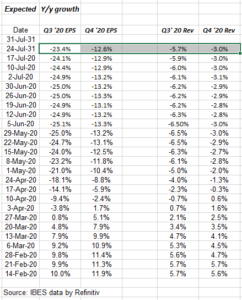
Looking at the “expected” SP 500 EPS and revenue growth for Q# and Q4 ’20 gives readers another perspective on the forward data for the end of 2020.
The source data is always IBES by Refinitiv but i like to look at the numbers from different angles – readers can see the steady improvement in Q3 and Q4 ’20 revenue from early May’s lows.
While still negative in terms of y/y growth, upward revisions and “less negative” growth rates are a good sign.
Summary / conclusion: Since this is being written before the close on Friday, July 21, 2020, the SP 500 value on the “forward earnings curve” is not the closing value for the day.
More to come over the weekend.
Remember all opinions are my own, and take everything here with great skepticism. An overbought stock market can decline as SP 500 earnings gradually improve.
Markets can change quickly, and without warning as the Covid-19 action demonstrates.
Thanks for reading.