Per ThomsonReuter’s “This Week in Earnings” published late Friday, 11.15.13, the “forward 4-quarter estimate” for the SP 500 slipped to $117.88 from last week’s $118.03.
Substantially all of the SP 500 has now reported (per Bespoke it is widely thought that with Wal-Mart’s earnings report, that quarters earnings season typically concludes), so with 463 companies having reported, year-over-year earnings growth for the SP 500 is +5.6%, on revenue growth of +3.2%. (Long WMT)
The p.e ratio on the forward estimate is now 15.2(x), the highest p.e we have on our spreadsheet since the summer of 2009, when the forward estimate was around $66. Factset notes that the 5-year “average” p.e ratio for the SP 500 is 13.0(x) and the 10-year average is 14.0(x). The SP 500 have been trading above its 5-year average since January, ’13 (or roughly 10 months), while the SP 500 has been trading above its 10-year average for the past 10 weeks (again, all this “average” data per Factset.)
The PEG ratio is just over 2(x) at 2.02(x).
The earnings yield on the SP 500 is 6.56%, which (again) is the lowest earnings yield since the summer of ’09. At one point in the fall, 2011, the earnings yield was over 9% – that is truly a remarkable stat, if you know anything about the Fed Model.
More importantly the “forward 4-quarter growth rate” for SP 500 earnings ticked to a 2-year high at 7.54%, and has broken out of the range it has been in since mid-September.
For the 3rd quarter, 2013, ThomsonReuters notes that SP 500 earnings have grown +5.6%, but if JP Morgan’s earnings are excluded, the y/y growth rate is +8.3%, or about where we predicted the 3rd quarter might finish. However if we add the Q3 ’12 growth rate of +1% to 2%, which was the lowest quarter of y/y earnings growth for the SP 500 post-2008, the combined “comp” is 4% – 4.5%, still below average but we expect that to improve.
We have been comparing ThomsonReuters and Factset data, relative to each other and by sector, and Factset is the more conservative of the two SP 500 earnings datasets. Generally, the growth estimates published by Factset are lower than Thomson’s. My understanding of this is Thomson uses the “operating eps” or whatever the analyst consensus is for that particular company. For example, when Micron (MU) reported their fiscal q4 ’13 in September, ’13, the GAAP EPS, which included a one-time extraordinary gain of $1.21, Thomson picked up the operating EPS number of $0.20 in their earnings detail. Since I don’t have access to Factset’s earnings and revenue detail by company, I have to fill in the blanks somewhat from the data provided, but the Factset growth data looks consistently lower than Thomson’s.
How important is JP Morgan ? Check this quick table we put together to quantify how important JPM is to the SP 500 and the Financial Sector using both Thomson’s and Factset’s earnings data:
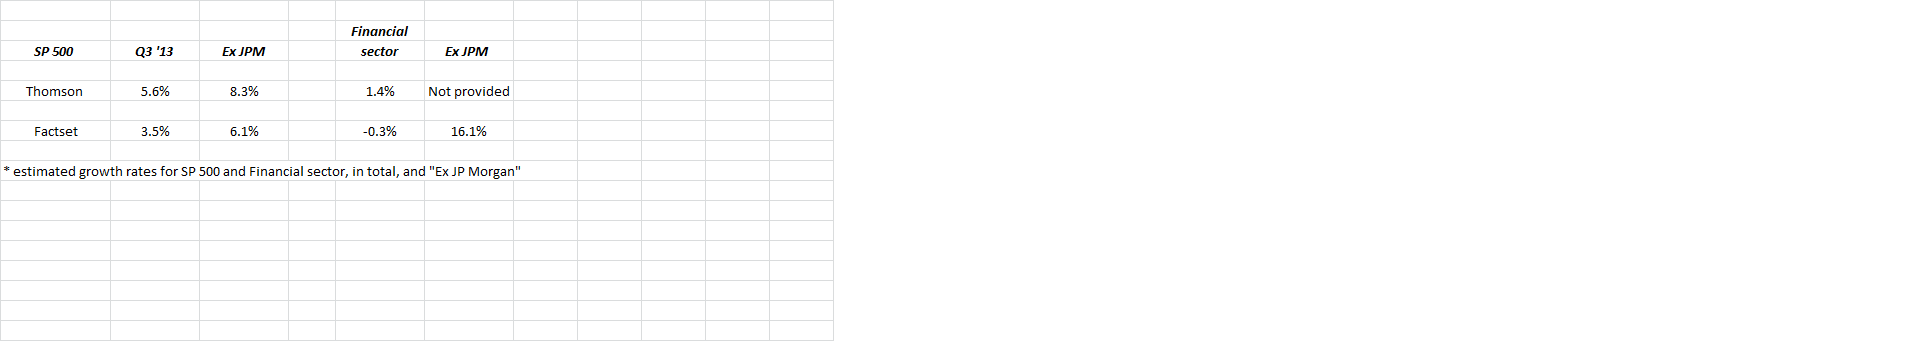
If Thomson provided the Financial sector earnings growth “Ex-JPM”, (and we went back and looked at the previous 7 weeks of reports) we couldn’t find it. Extrapolating the data and the relative differences between Factset and Thomson, we would estimate that for the Financial sector, ex JPM’s legal charge, that Thomson would show an 18% – 19% sector earnings growth rate for Financial’s, were it is disclosed.
On October 1, Thomson expected 9.4% earnings growth for the Financial sector, while Factset expected 9.0%, with the ultimate point being that the sector continues to be a good source of relative value, from an earnings growth and P.E (PEG) perspective.
We remain long JPM, BAC, SCHW, CME, GS, WFC in terms of our Financial sector overweight headed into year-end. The headlines and the DOJ have compressed p.e’s on the sector, although revenue growth for Financials has been pretty punk all year, between 0% and 3%. We still think the sector offers good value, but we’ll need to see a transition from loan loss reserve (LLR) reduction to revenue growth, even modest revenue growth.
For the SP 500 as a whole, we think the index is reasonably valued. The continued ascent of the “forward 4-quarter growth rate” for the SP 500 is critical to P.E expansion in our opinion.
The 4th earnings growth rate continues to look solid: I think we’ll see the first 10% earnings growth rate in q4 ’13, or the best growth in at least 2 years, when q4 ’13 starts to get reported in mid-January ’14.
(To make these reports digestable for our readers and to keep readers interested, we are going to do more frequent blog posts of a shorter length. I think we are going to scrap our Weekend Linkfest, simply because there are so many out there now. Josh Brown’s TRB post on the weekend, and the StockTwits linkfest are all superb, and far better than mine. However, if you reading this, let me know what you want to see.)
Trinity Asset Management, Inc. by:
Brian Gilmartin, CFA
Portfolio manager