1.) The biggest beneath-the-surface issue with the late 1990’s rally vs today’s market in large-cap tech and growth, was actually accounting quality. Qwest Communications and Joe Nacchio started the frauds unraveling in the late 1990’s, only to be followed later by Enron (Ken Lay and Jeff Skilling), Worldcom, (Bernie Ebbers), and even Lucent Technologies (Rich McGinn). After the 1990’s there were probably many more smaller cap companies that just evaporated, some due to inadequate business models, and not just aggressive accounting. (This blog never owned a share of Enron or Qwest, but did own some Worldcom (client asked me to buy), and some Lucent after they were spun out of A&T.)
One of the reasons this blog writes about earnings quality is because of the late 1990’s fiasco’s and the damage done to Wall Street and the notion of investment advice in general.
Today, although this blog isn’t chasing a lot of these names, looking at cash-flow and free-cash-flow vs net income does not indicate anywhere near the accounting quality issues that were seen in the late 1990’s. In fact cash-flow and free-cash-flow vs net income actually looks healthy in today’s bull equity market. Believe it or not, some companies like Coca-Cola (KO) or Oracle (ORCL) don’t look as healthy as other names held for clients, but it hasn’t hurt the stocks yet.
The tip-off to all this in the late 1990’s was actually comparing the tech sector’s 33% market cap to its earnings weight of 13%. That was way too low in terms of the ratio of earnings weight to market cap.
2.) Another difference in my opinion is the lack of real euphoria around today’s trading of tech stocks, particularly semiconductor stocks today, vs the late 1990’s. Micron Technology (MU) is 154% in 2026 YTD, while MU’s ’25 total return was 240%. Sandisk’s YTD ’26 return is 493% versus 2025’s total return of 755%, and these returns haven’t yet resulted in retail investors conducting mass firings of their value managers and looking for a growth advisor.
In the 1990’s, the semiconductor sector was just emerging, and hit it’s pinnacle with the buildout of the internet and Intel’s demand for more memory around it’s CPU or microprocessor units. Micron peaked in July, 2000, at $97.50, – after trading around $1 for most of 1990, before the first Gulf War which kicked off on August 1, 1990 -and MU never exceeded that all-time-high of $97.50 until 2025. MU closed Friday, May 15th at $724 per share.
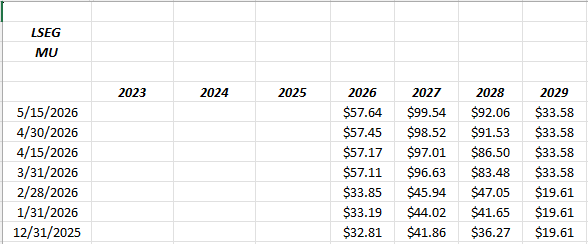
These MU EPS estimates show that the 2027 and 2028 estimates have already doubled for MU in the first 18 weeks of 2026. If MU were trading at $1,000 per share, versus the $724 from Friday’s close, the respective 2026, 2027 and 2028 PE for the memory giant would be 17x, 10x, 11x respectively.
The semi’s are typical momentum stocks, and don’t kid yourself, $40 of these expected earnings streams could disappear in a hurry.
This era (so far anyway) does not seem to be reminiscent of the late 1990’s where people quit their jobs to trade their investment accounts, or are screaming at their brokers (or advisors) to start buying tech stocks.
3.) Another difference about the 1990’s bull versus today’s market action, was the “binary” nature of the late 1990’s bull market: large-cap tech, and large-cap growth, was where the 80% of the benchmark’s action came from (read return). Small and mid-cap, international, value investors – anything that wasn’t large-cap tech or growth, was dead money for 5 years. Some value shops had to shut down, in the late 1990’s. In 2025, international equity had one of it’s best years since 2007. Emerging markets are also having a decent year, but the dollar strengthened sharply last week. In 2026, small and mid-cap, gold and silver, even convertible bond funds are outperforming the SP 500. Tech returns are strong, but investors can diversify and get better return than the SP 500.
In other words, some of these more-avoided asset classes the last 18 years – particularly international and emerging markets – are seeing strong annual total returns while the Nasdaq and Nasdaq 100 remain performing quite well.
My one worry regarding the emerging markets ETF’s like iShares Emerging Markets (EMXC) and the South Korea ETF (EWY) today, is that investors are really long “semi’s in drag”. Just make sure your international fund / ETF or emerging market fund / ETF isn’t a large cap tech fund with an EM wrapper.
4.) Difference #4 is the IPO craze in the late 1990’s versus the less-populated calendar today. I thought I read that 350 tech companies came public between 1995 – 1999. Cerebras (CBRS) this week and now SpaceX moving up their IPO is generating some excitement finally, but there seems to be a very different sentiment around IPO’s today. A well know fact is that companies are staying private longer, and the pre-IPO market seems to have become it’s own thing, although i don’t follow it much.
Intel, Microsoft, Cisco and GE all maxed out their market caps at $500 – $600 billion in March, 2000. It’s shocking to me to see the three largest components of the SP 500 – companies today like Nvidia, Apple and Microsoft – that combine for $10 – $12 trillion in market cap today.
5.) Finally, market breadth: the late 1990’s, all five years of the “average +25% return” for the SP 500 from 1995 to 1999, were all on “bad breadth”. The recent poor breadth figures for the 2026 bull market have just started in the last few months. If poor breadth continues for another 12 – 18 months, even as the Nasdaq and Nasdaq 100 outperform, then there will be some similarity to the late 1990’s.
Summary: The one metric that strikes me today versus the 1990’s is the “sentiment” around technology and trading this market by retail investors. The 1990’s was lunacy, and my own impression of today’s today’s trading environment is that this type of “enthusiasm” is missing from the media and retail in general. The one very sad story I remember from the late 1990’s was a woman about my age who worked for one of the momentum tech companies (while living in Chicago) and she decided to take early retirement, and a family member with no financial experience, and no experience managing portfolios, asked to manage the funds, which she agreed to. The seven-figure retirement package was all lost within five years.
Markets are very powerful, in both directions. The 100% rally in the Nasdaq from September ’99 to March 20th, 2000, was absolutely breathtaking, and was followed by an 80% drop in the Nasdaq from March 20th, 2000 through the fall of 2002. It seemed like that bull market would never end.
Charlie Munger used to caution that investors should be able to handle a 40% – 50% SP 500 correction, and still remain emotionally stable. After the 1930’s Great Depression bear market (which was worse than a 50% drop at its low), the 1973 – 1974 bear market in the SP 500 lasted about a year. That was Watergate, OPEC, President Nixon resigning, etc. The decade of the 2000’s was TWO 50% bear markets in one decade in the SP 500, 2001 – 2002, and then 2008, for entirely different reasons. It was basically a repeat of the 1930’s.
After 18 years, from the bottom of this secular bull market on March 9th, 2009, 18 years in length so far, we are getting close to the typical end for secular bull markets. The longest secular bull market – which was for the Dow Jones back then – was May, 1942 to the mid-1960’s, or 23 years. (This blog post from December ’26 talks a little about “probability of returns”.)
Sentiment does seem to indicate there is more upside to the SP 500 in ’26, however – as March, 2000 showed – risk can come on quickly.
None of the above is advice or a recommendation but only an opinion. Past performance is no guarantee of future results.
Thanks for reading.