Last Thursday, August 21, ’25, Walmart reported their fiscal Q2 ’26 financial results (fiscal ’26 ends January ’26, so it’s essentially calendar ’25 results we are seeing), with a whiff on earnings per share, thanks to workmen’s comp and what are being called general liability claims, while revenue was a slight beat.
No question the charges around workmen’s comp and general liability reduced operating income from +4.5% – +5% y-o-y (year-over-year) growth to a -0.5% yoy decline. EPS missed by 11%, as actual EPS was $0.68, while the estimate was $0.76.
This is likely continue through Q3 ’26 per the conference call.
The tell prior to earnings was that annual fiscal ’26 EPS was reduced to 4% starting in January ’25 (or just after President Trump was elected) while the initial growth for fiscal ’26 from last year’s estimates about fiscal ’26 were looking for +10% – +11% EPS growth.
Operationally, Walmart’s results looked fine, meaning the new emerging growth areas (the revenue flywheel) like Walmart Connect and Walmart Advertising each grew 31% and 46% respectively, while average ticket grew +1.5% and traffic grew 3.1%. Per the conference call notes, Walmart grew grocery, health and wellness and. more importantly, general merchandise, yoy.
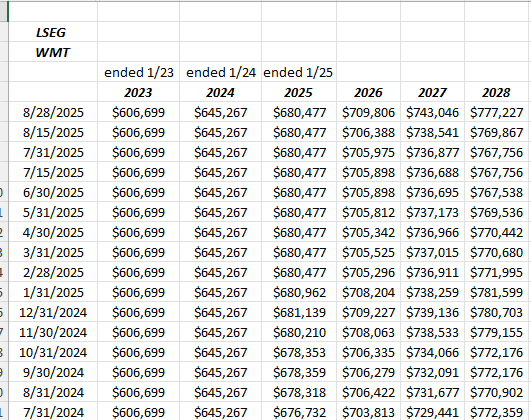
If you want to know that Walmart remains fine operationally, simply follow yoy sales growth vs yoy inventory growth. When inventory start to gets stacked up, cash-flow metrics start to suffer. In fiscal Q2 ’26, Walmart grew yoy sales over yoy inventory again:
![]()
Click on spreadsheet to expand and see the numbers.
For comparison, in calendar ’21 and ’22 when all of retail (including Amazon) were hit with too much inventory coming in after Covid, Walmart’s stock price fell from $53 to the high $30’s.
One positive:
Walmart’s forward revenue estimate revisions took a big jump after last Thursday’s earnings. That’s a plus.
Source: LSEG EPS and revenue estimates
Earnings estimates moved very little after last week’s earnings report, but the revenue estimates have started to move higher again.
Valuation:
Most shorts or more conservative long-only investors point to Walmart’s 35x earnings multiple for fiscal ’26, (as well as the comparison of the 4% expected EPS growth rate for fiscal ’26) and conclude the stock is overvalued, and with good reason.
However, Walmart’s cash-flow-from-operations (CFFO) is also pretty formidable, and at $95 per share, Walmart’s trailing-twelve-month (TTM) CFFO means WMT is trading at just 18x CFFO/PS, versus the 38x PE (earnings) multiple.
The cash-flow multiple isn’t cheap either, but it does allow readers to better understand the business.
In terms of earnings quality – comparing Walmart’s TTM CFFO to WMT’s TTM net income, here’s the excel spreadsheet that shows Walmart’s cash-flow in relation to net income:
![]()
Again, click-on and expand the spreadsheet, and look how free-cash-flow suffered from the inventory build in 2022, which was referenced above.
What’s interesting is that for the last 8 quarters, Walmart has averaged $2 in cash-flow from operations, for every $1 in net income.
Erin Lash, who plies her trade at Morningstar and is a very-good retail analyst, thinks WMT’s fair value is $64 per share, which is about 25% lower than where this blog’s valuation puts Walmart’s value.
The key metric for Walmart is the operating margin: assuming that the regular operating margin for the retail giant is 4.50% (this last quarter was 4.44%), and with the new flywheel revenue and supply-chain automation, let’s say “peak” Walmart operating margin is 6%, or a 150 basis point improvement. If we assume $700 billion in revenue, which is an additional $10.5 billion in operating profit, and assume 8 billion shares outstanding, that’s a $1.31 or 51% increase in EPS from TTM EPS of $2.53 (over time) with assumptions being no revenue growth and no shares repurchases.
Most consumer staples stocks trade at rich multiples, like a Coca-Cola, Procter & Gamble, Colgate-Palmolive, etc. The trade-off traditionally has been the higher price (and valuation) is justified with consistent and dependable earnings growth that these stocks generate over time, or to put it in investing or statistical jargon, the low standard deviation around EPS and revenue generation. The world is always changing though: PG was hammered after 2008 after the consumer traded off from pricey dependable household brands to discount labels like Costco’s Kirkland. Look at Coca-Cola when Covid struck and the carbonated business to stadiums and ballparks and just about any sporting event just collapsed.
Even on a 12 – 14 month basis, looking into calendar 2026 as Walmart’s one-time expenses end and the tariff issues settle out, the path forward for Walmart looks ok, and given Walmart’s business model, the retailer wins with recessions.
Summary / conclusion:
At it’s core, Walmart is a merchandising juggernaut, pulling in good from suppliers and making them convenient to purchase for their customers, and in order to do this properly and maintain every-day low prices (EDLP) for their customers, they are have to run a very lean and low-cost operation. To long-term retail analysts, this isn’t really a surprise.
The tariffs and the workmen’s comp and one-time labor charges are likely to extend for another quarter, but by Walmart’s fiscal Q4 ’26 (January ’26 quarter), the operating expense and margin pressure should start to fade.
In this blog’s earnings preview it was noted that Walmart was trading at about a 10% valuation premium to where this blog had fair value for the stock and that was a fair call given the pullback in the stock. Walmart’s 200-day moving average is at $94.67 and below that the stock could test the April lows near $83, if seasonal weakness develops in September and October ’25.
It’s a long-term holding for this blog and remains a Top 15 holding for clients. In fact, I’d like to add more for clients if it trades below $90, but I don’t think it will.
None of this is advice or a recommendation, but only an opinion. Past performance is no guarantee of future results. All EPS and revenue estimates cited on this blog, are typically sourced from LSEG.com. None of this information may be updated and if updated may not be done so in a timely fashion. Readers should gauge their own comfort with market and account volatility and adjust accordingly.
Thanks for reading.