When Nike reported their fiscal Q2 ’25 earnings on December 19, ’24, Matt Friend, Nike’s CFO guided the Q3 ’25 quarter to expect a “low-double-digit” drop in revenue and decline in gross margin of 300 bp’s to 350 bp’s for Q3 ’25, and a slight decline in SG&A dollars for the quarter.
Nike is expected to report their fiscal Q3 ’25 earnings on Thursday night, March 20th, after the closing bell:
- As the consensus estimates stand right now, the Street consensus for fiscal Q3 ’25, is looking for $11 billion in revenue, $483 million in operating income, and just $0.29 in earnings per share (EPS) for expected y-o-y declines of 11%, 64% and 70% respectively for the three key metrics.
- For fiscal Q4 ’25, consensus is looking for $0.28 per share on $11.032 billion for expected declines of -70% and -11% for the final quarter of the fiscal year.
- For the fiscal ’25 year in total (ends May 31), consensus estimates expect Nike to see a 47% decline in EPS, on a 10% decline in full-year revenue. Nike has only had 3 years of negative growth since the mid 1990’s: fiscal 2020 (mostly Covid and pandemic), fiscal 2010, and then fiscal 1999 (i.e. the so-called brown shoe craze).
Reading through the 2nd quarter ’25 conference call notes, both the CEO Elliott Hill and the Matt Friend referenced numerous product segments and channels where excess inventory was going to need to be reduced, which is what has had the significant influence on the financial metrics.
This is normally of little interest to readers, but here’s a history of Nike’s y-o-y revenue growth vs inventory growth since early 2020.
![]()
You can see the post-covid difficulties with inventory growth and then clearing that inventory, and now the 4 straight quarters of flat to negative revenue growth (y-o-y), so as an analyst and investor in the common stock, it becomes difficult to know how of Nike’s inventory liquidation is due to bad product, weak sales, or bad channel mix, and how much is just clearing the deck to make room for new products.
China, which is 13% – 15% of Nike’s total revenue, but depending on the quarter, can represent 25% to 50% of Nike’s total EBIT (earnings before interest and taxes, which is really another proxy for operating income), is another issue that is overhanging Nike, especially given the tariff tiff, and the general anti-American feeling the last few years, from trade issues with China.
Don’t kid yourself: Xi Jinping and the Chinese government can exert enormous influence over Chinese consumer attitudes towards American products. Both Nike and Apple have seen considerable impact from a Chinese slowdown of their respective products.
Since the November ’21 quarter, or the last 13 quarters, the y-o-y growth of Nike’s China revenue has been negative for 9 of those quarters.
Margin Impact:
Nike’s gross margin trend:
- 4-qtr avg: 44.6%
- 12-qtr avg: 44.4%
- 20-qtr avg: 44.3%
- 40-qtr avg: 44.6%
While gross margin has been relatively stable the last 10 years, it’s going to get whacked this fiscal Q3 ’25 and possibly even fiscal Q4 ’25.
Nike’s operating margin trend:
- 4-qtr avg: 11.16%
- 12-qtr avg: 11.99%
- 20-qtr avg: 11.79%
- 40-qtr avg: 12.43%
Like the gross margin, Nike’s operating margin will likely get hammered the next two quarters.
The question is, does this finally put a floor under the stock ?
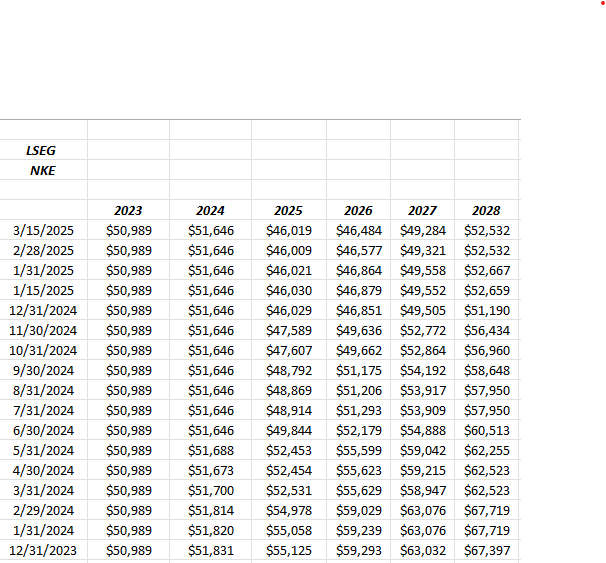
Nike EPS and revenue estimate revisions:
EPS estimate revisions.

Source: LSEG
Ignore the floating cursor, but look at the fiscal ’25 column. Just one year ago, Nike’s EPS estimate was double what it is today. Put another way, investors have seen a 50% downward revision in the fiscal ’25 EPS estimate, over the last 12 months, a lot of it coming after the December 19, ’24 guidance.
Revenue estimate revision:
Perhaps one small consolation, Nike revenue estimates have been relative stable since the December ’24 report, but saw bigger revisions after the September ’24 report.
The problem is revenue estimates are still declining, albeit more slowly.
There’s no question, investors need to see fiscal ’26 and ’27 revenue estimates start to flatten out.
Valuation:
At it’s peak in late 2021, Nike had a market cap of $290 billion, today that same market cap is $106 billion after Friday’s close.
After fiscal ’25’s expected decline in EPS of 47%, Nike is expected – per the analyst estimates – to average 21% EPS growth through fiscal ’26 – through fiscal ’28. After fiscal ’25’s 10% drop in revenue, Nike is expected to average 5% revenue growth per year from fiscal ’26 – through fiscal ’28. We’ll see how that changes over the next few quarters.
Trading at $71 per share, many of Nike’s valuation metrics have finally come back into the “well that’s a lot more reasonable” zone. The stock was obscenely overvalued for years, and has fallen from it’s high of $179 – $180 in November ’21, to $71 after Friday, March 14th’s close.
Even though Nike sports a 34x multiple on quite depressed earnings, the cash-flow multiple (trailing twelve month or TTM) is 17x while the free-cash-flow multiple is 20x. Ex the balance sheet cash, Nike is trading at 15x and 19x the cash-flow multiples.
Speaking of cash-flow, Nike has managed to sustain free-cash-flow growth despite the inventory issues although we’ll see how that holds up after q3 and q4 ’25, but investors could reasonably expect that cash-flow and free-cash-flow might not look that great until fiscal ’26.
Nike is still buying back stock though, and recently gave a nice boost to the dividend, and has a debt-to-cap ratio of 36%, which is hardly excessive.
The gentle appeal to CFO Matt Friend will be repeated here, but Nike remains one of the few world-class brands that doesn’t report the cash-flow statement with quarterly earnings, and requires investors to wait for the 10-Q and 10-K. Nike does provide good detail in it’s quarterly earnings release (with the exception of the cash-flow statement), especially the global regional revenue and EBIT metrics, so that is appreciated.
Summary / conclusion:
The big question remains, how long will it take Elliott Hill to generate some forward momentum for the product line, particularly revenue growth ?
The Nike commercial during the Super Bowl, and then the Kardashian announcement gave the stock a temporary lift, but Nike is close to breaking it’s 52-week low of $68 per share, just prior to Super Bowl weekend.
It was noted where the Jefferies analyst Randal Konik, upgraded Nike on February 24th, ’25, assigning a $115 price target to the stock, when the stock price was only 10% higher than it closed Friday, March 14th. I like Jefferies research, i.e. their tech analyst and their retail work is quite good. Konik was particularly tough on Nike after the December 19th ’24 earnings release, but has had a change of heart since.
Seriously, Elliott Hill has some difficult work ahead, but from everything read about his Nike tenure, and his ability to sustain a positive culture at Nike corporate, he seems like the right guy for the job.
Here are previous Nike articles published on this blog: here, here, here, here, here.
This blog was a early (and wrong) with it’s initial purchases of Nike stock, with the high cost basis today about $110, which has been averaged down. The stock has been slowly accumulated for clients, with the majority having a cost basis between $80 – $90 per share, and the plan right now is to continue to scale in
Clients hold a 1.2% position in the stock at present.
None of this is advice or a recommendation, but only an opinion. Past performance is no guarantee of future results.