Both Merck and Pfizer are expected to report their Q2 ’24 financial results on Tuesday morning, July 30 ’24, before the opening bell.
Pfizer (PFE):
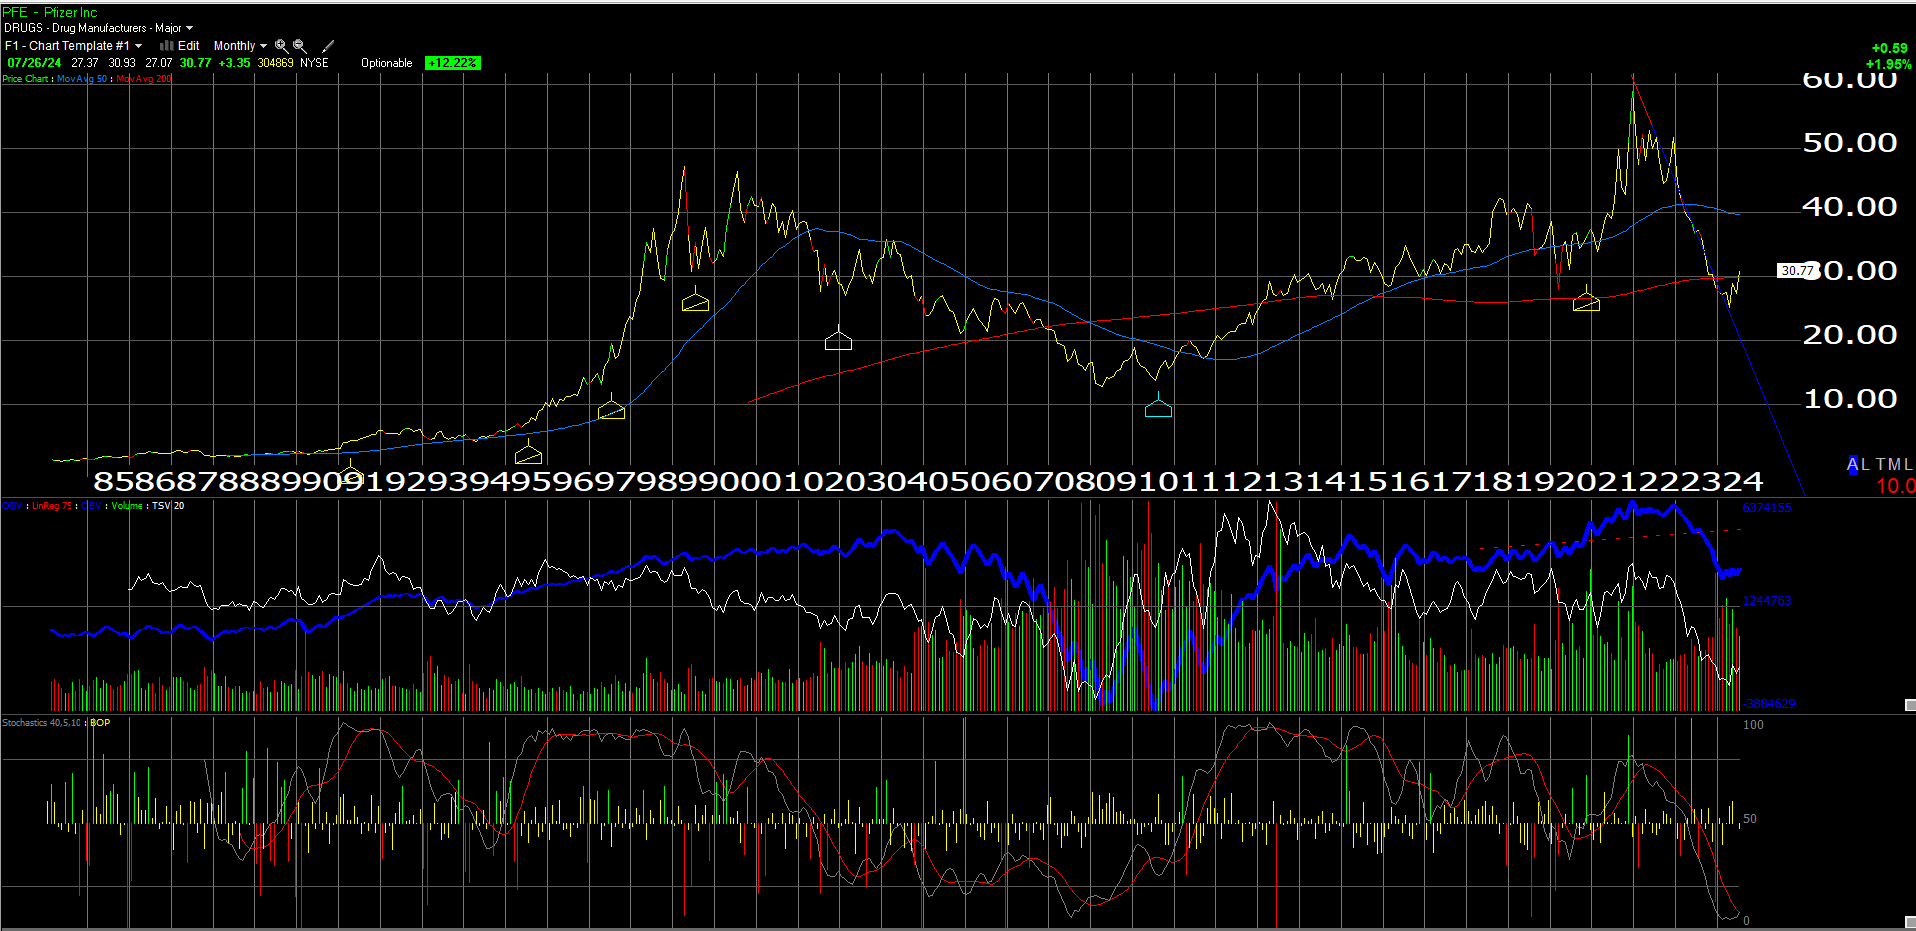
Post-Covid, Pfizer has fallen from $60 to the $25 – $30 price area as it’s two Covid drugs, Paxlovid and Comirnaty, have seen revenue dry up with the ending of the pandemic.
Technically, as this monthly chart shows, the stock is now more oversold than any time in it’s history as a public company (even more oversold than 2008), but the stock has now traded back above it’s 200-month moving average in the last 30 days, however that piercing of technical resistance doesn’t mean the stock can’t be trading in the low $30’s 2 years from now either.
Consensus estimates for Tuesday morning’s Pfizer earnings release is expecting $13 billion in revenue, $4.1 billion in operating income, and $0.46 per share for expected y-o-y growth of 2%, +16% and -31% respectively.
Pre-Covid, before Pfizer saw it’s EPS spike to $4.42 in ’21 and $6.58, Pfizer earned between $2.20 and $2.95 per share from 2015 to 2019. The current PFE estimates for ’24 through ’26 look to be projecting the same level of growth as the last 5 years of the 2010 to 2019 decade.
Morningstar puts a fair value estimate on PFE of $42 per share, with a wide moat, and thinks that the portfolio of drugs and vaccines can support enough cash to sustain the dividend, (currently 5.46% as of Friday, July 26th’s close), but I suspect the sell-side is waiting to see what Pfizer can take from the $43 billion acquisition of Seagen. Morningstar notes that PFE will cut nearly $4 billion in operating expenses, between mid ’23 and the end of ’24, so with 5.6 billion shares outstanding, that amounts to $0.71 per share in just expense savings.
Here’s how the EPS and revenue estimates fall out:
- ’26 EPS: $2.92 or expected 6% EPS growth in ’26:
- ’25 EPS: $2.76 or expected 16% EPS growth growth in ’25;
- ’24 EPS: $2.37 or expected 30% EPS growth in ’24;
- ’28 revenue: $63.3 billion or expected revenue growth of 1%
- ’27 revenue: $62.9 billion, or expected revenue growth of 4%;
- ’26 revenue: $60.67 billion or expected revenue growth of 4%;
There is no question the big risk today is the ability for PFE to sustain the free-cash-flow to cover the dividend, which amounts to $9.3 billion per year, versus the $5.1 billion TTM (trailing twelve-month) free-cash-flow. (Here’s the latest article on that topic from this blog.) The Seagen acquisition added $29.5 billion of term debt (increasing PFE’s long-term debt from $31.7 billion to $61.4 billion). The debt-to-capital ratio is 28% as of 3/31/24, but of the $221 billion in assets at Pfizer as of 3/31/24, $63 billion is goodwill. Another $69 billion is “intangibles” so 60% of Pfizer’s balance sheet is pure “air”. Pfizer could add some debt to sustain the dividend, but you’d have to think the rating agencies would look hard at that.
Pfizer’s current senior unsecured debt ratings at both S&P and Moody’s are A / A2.
Pfizer’s EPS and revenue estimate trends (not shown) have been gradually increasing since March – April of ’24, but a longer time is required to flush out the durability and sustainability of the momentum.
Pfizer better be able to extract some value from Seagen, and hopefully some of it’s cash flow.
It’s time for Pfizer to make hay after the pandemic spike, when the stock jumped from $30 in 2020 to $60 in late ’21. This blog owned the stock and thought that it could find some additional revenue from the pandemic R&D, but wound up selling near $47 on the way down.
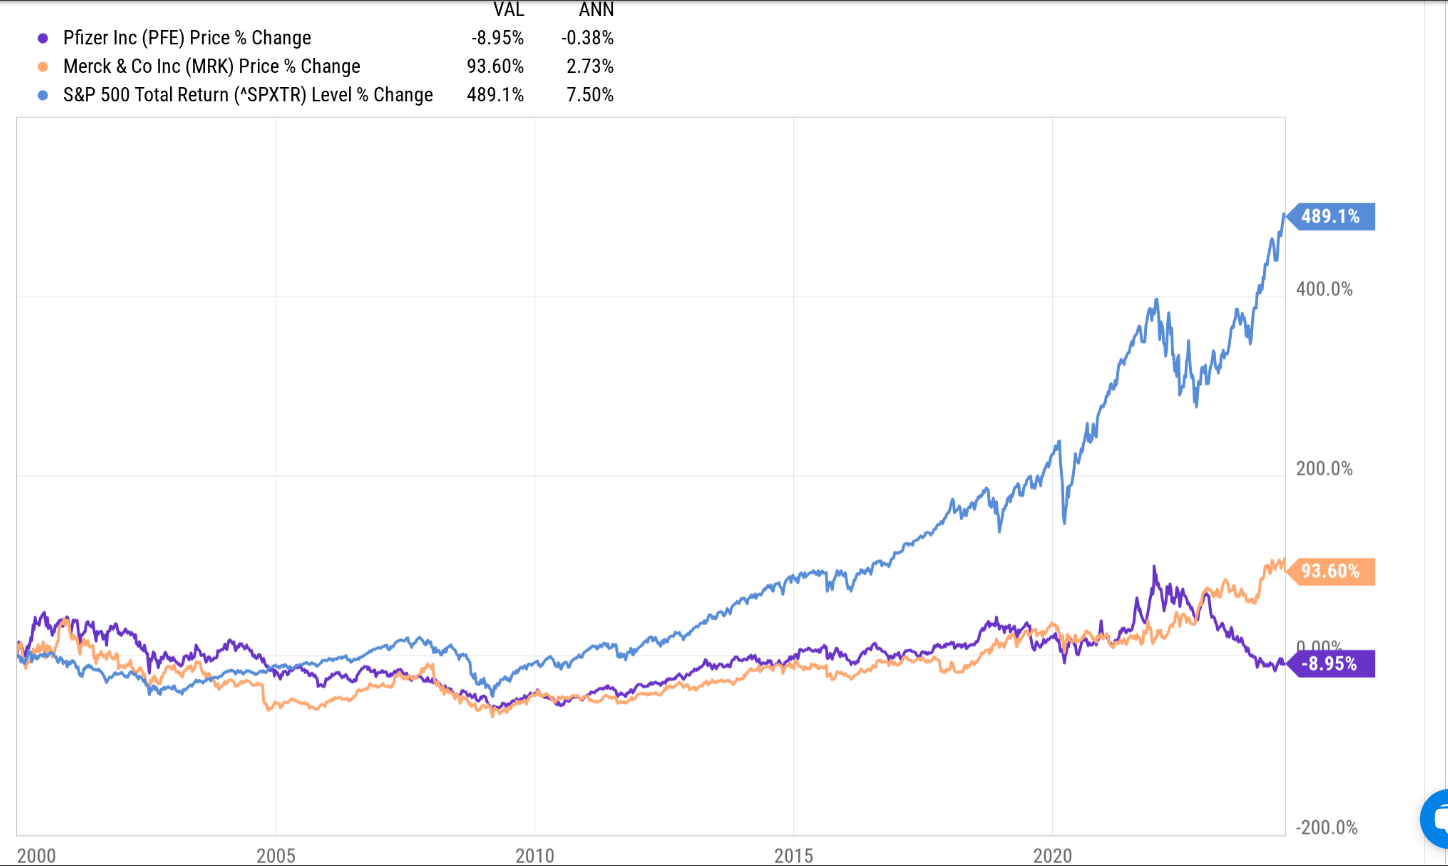
This total return chart from Ycharts shows the total return for Pfizer and Merck since the January 1, 2000.
This will be covered more in the conclusion.
Merck (MRK):
The advantage to Merck in terms of a comparison to both Pfizer and the other large-cap pharma stocks, is that Merck didn’t get involved in the Covid frenzy in terms of the race for a vaccine (Merck released a drug called Legevrio but I don’t think sales were material), and while someone might think this is a negative, the drug giant isn’t really involved in the GLP-1 or weight loss chase either, and instead is focused on Keytruda, (NSCLC or non small-cell lung cancer drug) which is a substantial winner for Merck, and is also getting contributions from Gardasil (HPV vaccine).
Consensus is expecting $15.8 billion in revenue, $5.7 billion in operating income and $2.15 in EPS, for expected y-o-y growth in revenue of 5%. Merck acquired Prometheus Biosciences in the 2nd quarter of ’23, and in what I thought was an unusual move, ran the acquisition straight through R&D on the income statement, resulting in big writeoffs for operating income and EPS, thus it’s tough to compare both metrics in terms of y-o-y growth.
In Q4 ’23, Merck guided to ’24 of $62.7 to $64.2 billion but 2024 consensus for the Street is already at $64.3 billion as of this weekend.
Let’s see what happens to revenue estimates after Tuesday’s earnings.
Today, Merck is really all about Keytruda and what the pharma giant can squeeze from it, as it awaits further pipeline development. Keytruda is set for expiration in 2028, so there is at least 3.5 years of revenue strength left, and Morningstar has noted that they expect 12% revenue growth operationally from Merck, over the next 5 years.
With MRK trading around $125, it’s roughly 13x forward estimates for the next 3 years with expected EPS growth of 25% and 10% in 2025 and 2026.
Summary / conclusion:
It was a deliberate decision to write about Pfizer and Merck at this time since, the market conversation is still dominated by Megacap 7, semi’s and growth stocks like the GLP-1’s i.e. Lilly (LLY) and Novo Nordisk (NVO).
From a portfolio construction standpoint, Merck and Pfizer represent uncorrelated large-cap pharma. Both stocks made all-time-highs in the late 1990’s and early 2000’s around Viagra (PFE) and Merck’s Lipitor, only to get crushed with the collapse of both technology and large-cap growth.
The above-performance chart shows how badly Merck and Pfizer have lagged since January 1, 2000.
Today, I see the GLP-1’s and the weight loss stocks, much like Pfizer and Merck were between 1999 and 2001. That might garner some questionable comments, but note how the GKP-1’s have sold off with the correction in the Megacap 7 in the last 3 weeks, particularly Eli Lilly (LLY) and Novo Nordisk (NVO).
Merck broke above it’s December, 2000, high of $92 in the 2nd half of ’22. There looks to be good support for Merck if it’s needed at $95 or the 50-week moving average on Merck’s weekly chart. Pfizer’s still a colossal mess. Some have speculated that’s it’s quite amazing that the Pfizer CEO and the Board have not been completely canned.
The real technical positive for Pfizer is that it’s finally trading back above it’s 200-month moving average, and you get a bond-like 5.46% dividend yield fundamentally to wait and see if anything can happen with the Seagen acquisition.
Pfizer’s trading at a bigger discount to perceived fair value than Merck, but I have more confidence in Merck, given the ’24 revenue guide and the expected revenue growth over the next 5 years. Merck is the far bigger position in client accounts, although some PFE has been added as the stock improves technically.
None of this is advice or a recommendation, but only an opinion. Past performance is no guarantee of future results. Investing can involve the loss of principal even for short periods of time. All EPS and revenue data is sourced from LSEG.com.
Thanks for reading.