The last time the Fed cut the fed funds rate, the Fed easing monetary policy started with Janet Yellen in Q4 ’16 and ended with Jay Powell in late 2018.
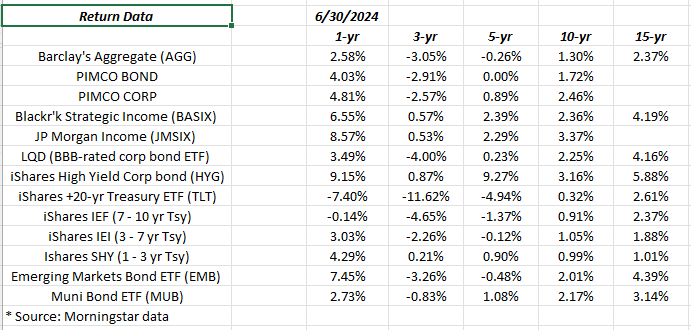
The TLT (iShares +20-year Treasury ETF) returned +14.12%, in 2019 as the Fed reduced the fed funds rate slightly.
That TLT return data is only being cited to give readers a reference point for what was then thought to be “normal” monetary policy, before the US economy returned to ZIRP (zero interest rate policy) with the pandemic.
For a longer perspective, most Americans seem to think zero interest rates are a normal policy since so many Americans only became aware of the Fed and monetary policy with zero interest rates from 2008 to late 2016, then March, 2020 to March, ’22. (If memory services correctly, rates even went to near-zero shortly after 9/11, thanks to structural damage to the buildings around the World Trade Center, which housed some of the Fed’s transmission technology, ultimately cutting the fed funds rate to 1.75%. )
Tomorrow morning’s, July 11th ’24, Core CPI is expected to be friendly again, at +0.2%.
Rick Reider, BlackRock’s Global Fixed Income CIO posted this table to X, noting the positive correlation between Core CPI upside and downside surprises, and the change in the long bond that day.
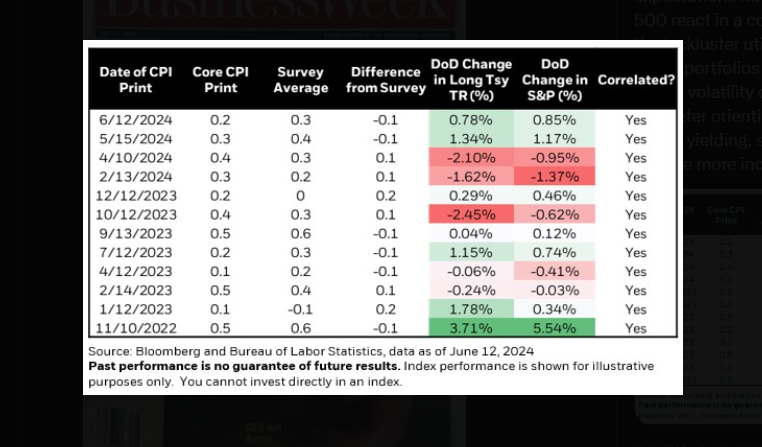
Shelter continues to be an issue for the index. There has been a lot of chatter about the difference between the government’s “shelter” calculation, and real-time “rental” data from the US multi-family housing market. (I don’t know enough about the calculation differences, so an opinion can’t be rendered.)
Summary / conclusion: Looking at the annual return table at the top of the page as of June 30 ’24, credit (mainly high-yield) has outperformed “duration” or more interest-rate sensitive securities, with the exception of high-yield muni’s.
If the Fed and Jay Powell, do choose to cut the fed funds rate in the next few months, readers need to be cognizant that outside of the fed funds rate, the Fed has no control over the rest of the yield curve, outside of some quantitative easing / tightening mechanics.
Investors could very well end up with higher Treasury yields as we move out the Treasury curve, after what would likely be a decent initial rally along the Treasury curve. There are several reasons the Fed could reduce the fed funds rate that are less correlated to inflation and the US economy, and that is the interest costs on Treasury debt thanks to deficit spending, and the inverted yield curve, which is really not helping the US banking system today.
This blog is long TLT, AGG, TIP, the LQD, and some individual Treasury securities, for “duration” exposure in client bond portfolios.
The 10-year returns on the various bond asset classes above, could use a broader bond market rally.
However, post-Presidential election and beyond, a yield curve steepening, and higher longer-maturity Treasury yields, can’t be counted out.
None of this is advice or a recommendation, but only an opinion. Past performance is no guarantee of future results. Investing can and does involve the loss of principal even for short periods of time. All the return data above is sourced from Morningstar.
Thanks for reading.