In Wednesday morning’s, June 12th, 2024 CPI report it looked great across the board, until you came across the CPI services component, and in fact CPI Services (ex-shelter) inflation is still up 5% yoy. Unfortunately, I don’t have any comparison – whether last month was +7% or +3% – but the size of CPI Services ex-Shelter figure I found surprising.
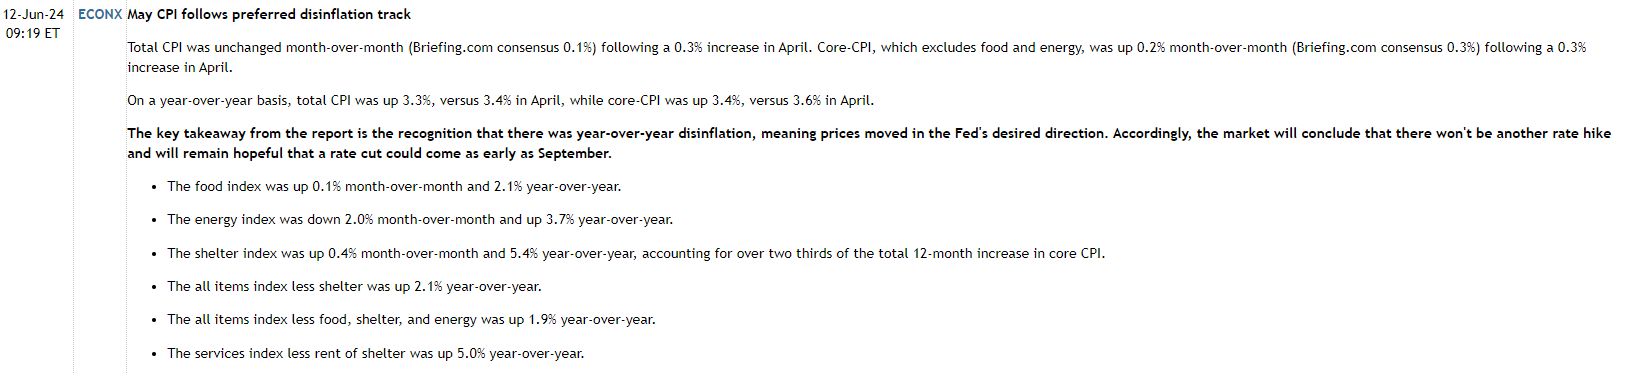
This first summary of the May CPI data, references the CPI services ex-shelter, cut-and-pasted from Briefing.com
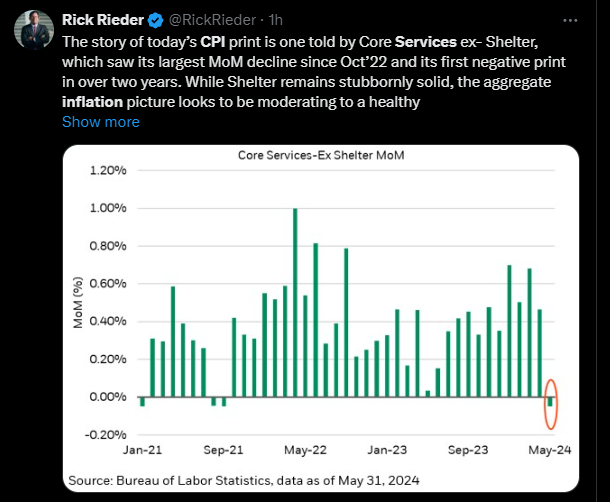
Rick Reider of Blackrock threw the above chart up on X later on Wednesday, and talked about the monthly change in May CPI Services ex-Shelter, which gives a monthly view of Services ex-Shelter trends. That chart looks much better than the yoy +5% figure.
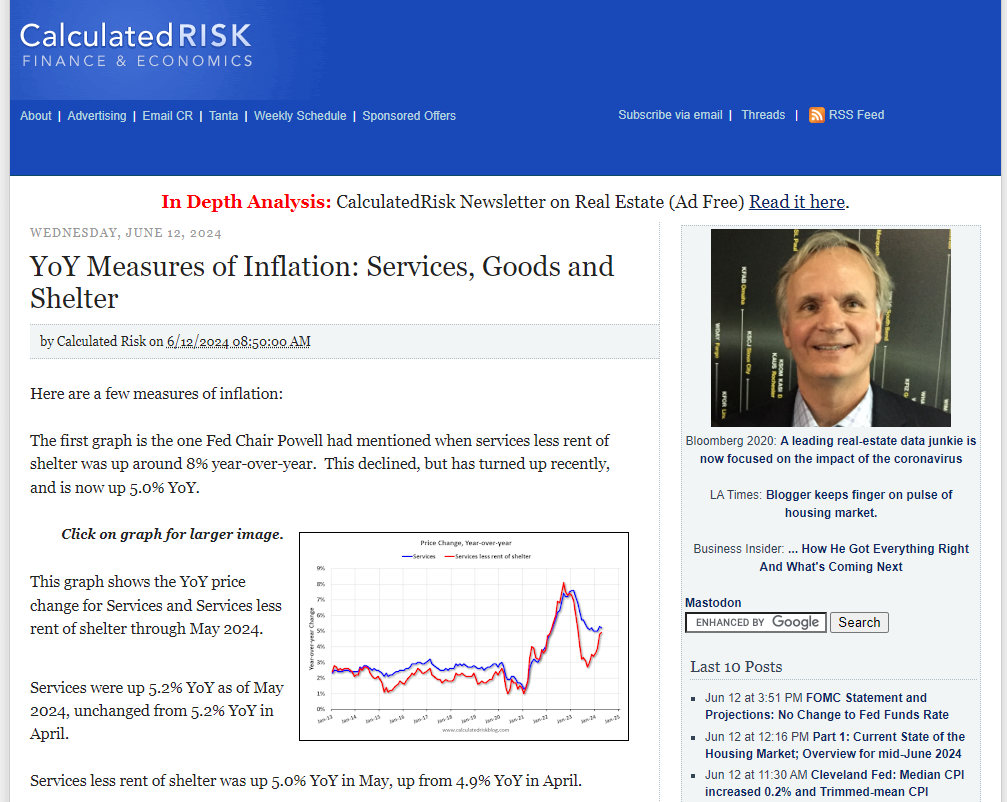
Finally, because I was wondering if the Briefing.com CPI summary at the top of the page was perhaps a typo on Services ex-Shelter, the goal late yesterday was to confirm that +5% y-o-y figure, and Bill McBride’s blog, i.e. Calculated Risk, confirmed the yoy growth of CPI Services ex-shelter at +5%.
Summary / conclusion: In early February ’23, Steve Liesman did an interview with Raphael Bostic of the Atlanta Fed, and the reason I like to listen to listen to Bostic is that he’s always direct and to the point. He told Liesman that morning (and it was nonfarm payroll Friday) that the Fed monetary policy was looking to cool services growth within the US economy, in that services was still way too hot, even though more than 2/3rd’s of the economists polled by the Wall Street Journal in late 2022, thought the US economy would be in recession in 2023. (Today, goods inflation is flat to negative, but goods i.e. manufacturing is now a much smaller part of the US economy than even 50 years ago. Today, services is about 85% of GDP growth versus goods / manufacturing, given the last data I saw.)
Services ex-shelter inflation still looks pretty elevated, although real-time rent data seems to be contradicting the “shelter” component of the CPI, meaning “shelter” within the CPI components, which is 30% of the index, is overstating actual shelter inflation at this point.
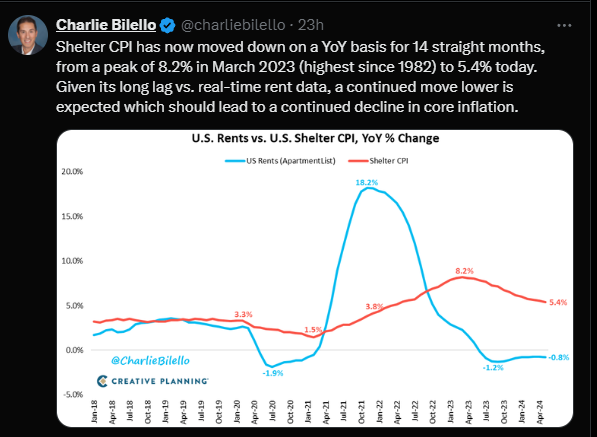
Charlie Bilello is an excellent technician. He threw out this chart later on Wednesday, June 12th, 2024, comparing and contrasting Shelter CPI vs real-time apartment rents.
Alan Greenpsan noted in the 1990’s that the CPI inflation measure probably overstated true inflation during the late 1990’s.
The whole point of this being for readers, that data can look good or bad, depending on the time frame, (i.e. monthly, 3-month annualized, 6-month annualized, year-over-year) so look across various frames.
Ultimately though if you want a truer read on various economic releases, watch “price”. The bond rally yesterday was positive, but it was noted that the TLT volume was just barely above average. This mornings jump in jobless claims may be more meaningful for the Treasury market since it could imply the US economy is weakening, if only a little. (We have to watch the revisions.)
As technical analysts have stated over the years, “price is everything”, meaning the price action of what you are long, short, etc. should be the primary determinant of your subsequent action.
It does appear some aspects of CPI – Shelter are inflated, and sending inaccurate signals, but ultimately the bond market will tell us that.
Not the usual blog post today – a little narrow and wonky – but thanks for reading.
None of this is advice or a recommendation, but only an opinion. Past performance is no guarantee of future results. Investing can mean the loss of principal, even for short periods of time.