The sell-side consensus around Amazon looking out 3 – 5 years is that revenue growth is expected to slow, i.e. to never return to the +20% pace the ecommerce giant generated from 2002 to 2021, when annual revenue growth averaged 29% per year, to today’s current expected revenue growth for the next 3 years of 10% – 12%.
This isn’t really a surprise since Amazon is expected to generate $614 billion in annual revenue in 2024 (the current sell-side consensus estimate), and as those very large numbers are hit, to continue to grow at a 20% annual revenue rate, means that eventually Amazon will outgrow the entire US economy.
Jeff Bezos resignation in late 2021 not only top-tipped the stock at $188 – $189 per share, but it also marked the end of +20% annual revenue growth.
Looking over the spreadsheet and Q4 ’23 financial results, it was interesting that the North American operating margin hit its highest level ever at 6.12%. During Covid and 2021 when anything ecommerce-related benefitted from WFH and ecommerce delivery, the North American margin hit 5.36% (June ’22), which was the previous high print, after late 2018’s 5.92%.
Here’s what else was picked up from Q4 ’23’s results and looking at the numbers:
- International operating income (23% of total AMZN revenue is international) was still negative, and has been negative on an operating income basis for the last 10 quarters. Going back to 2013 – 2014 international operating income has been only sporadically positive. Management’s never addressed it ( to my knowledge) either.
- AWS operating margin, the last 2 quarters of ’23 was 30.3% and 29.6% and is returning to normal, i.e. , after three consecutive quarters of yoy operating margin declines.
- Although AWS is just 14% of Amazon’s revenue, it makes up more than 50% of Amazon’s total operating margin. During Covid – when inventory swelled and revenue growth slowed – AWS comprised all of Amazon’s operating margin.
- Advertising rose 27% in Q4 23, it’s 5th consecutive quarter of accelerating advertising revenue growth;
- Amazon hasn’t repurchased any stock since the $3.3 billion in June ’22 and the share count has been mildly dilutive since;
Let’s look forward:
AMZN’s EPS estimate trend:
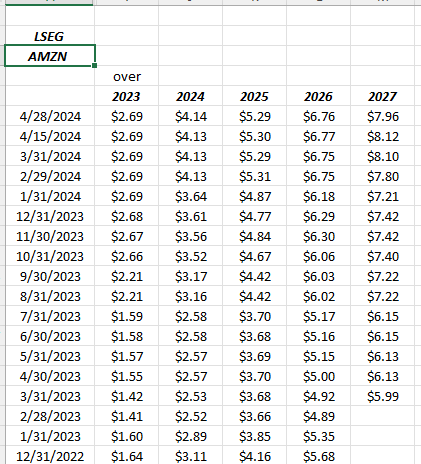
Readers can see the acceleration in EPS estimates that started mid-to-late ’23.
![]() Click on this spreadsheet just above to see the progression in Amazon’s North American operating margin.
Click on this spreadsheet just above to see the progression in Amazon’s North American operating margin.
AMZN revenue estimate trend:

The difficulty for Amazon going forward will be to generate healthy revenue growth for a company with a $2 billion market cap, and that is expected to generate $641 billion (or more) in revenue in 2024.
The big picture:
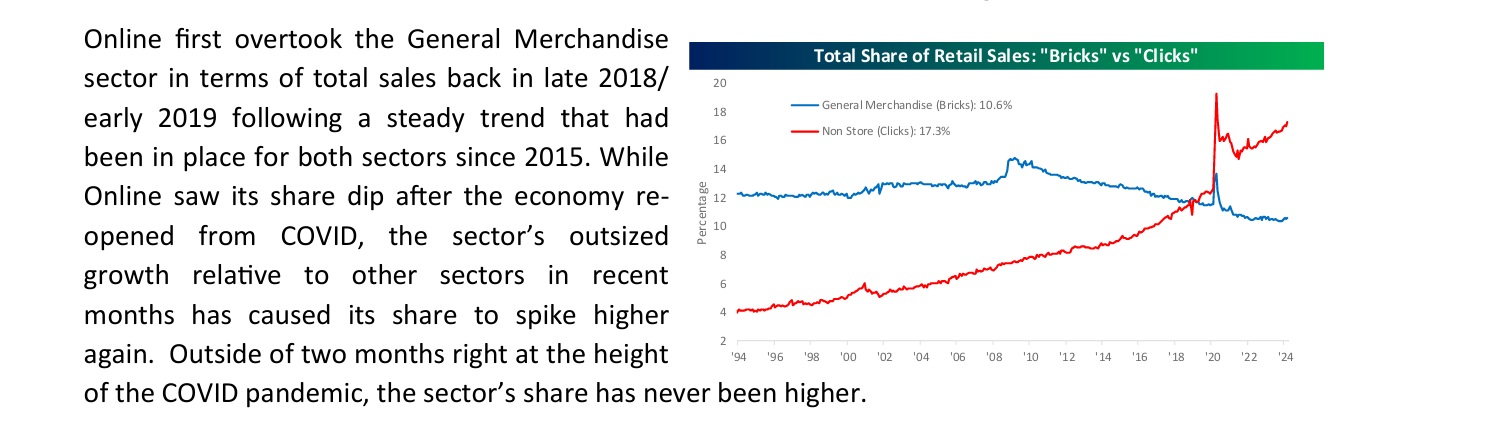
If readers ever want a “big picture” take on ecommerce vs brick-and-mortar market share in terms of US retail sales, Bespoke puts out this graph with comments after every monthly retail sales report.
Covid and the pandemic threw all of consumption and consumer spending into a tailspin, both during and following, but the transportation and logistics is back to normal, and the significant inventory builds that crippled all of large retail have ended, so with March ’24 retail sales it appears the uptrend in market share vs bricks-and-mortar is improving once again (red line).
Valuation: When Amazon reports Tuesday night, April 30, ’24 after the closing bell, street consensus is expecting $0.84 in EPS, $11 billion in operating income and $142.6 billion in revenue for expected yoy growth of 171%, 15% and 12% respectively.
At $180 per share, AMZN is trading at 43x expected 2024 EPS of $4.14 per share, with an expected growth rate of 15% in EPS in ’24. Using a 3-year “average” for AMZN, the stock is trading at 35x expected EPS, which is expected to average 23% over the next 3 years.
The 2024 EPS estimate has steadily come down from an expected growth rate of 62% one year ago to 15% today.
Other important valuation metrics are a 3x price-to-sales valuation and a 21x and 64x price to cash-flow and price to free-cash-flow (FCF) valuation.
Again this is all just coming out of the Covid constipation, so free-cash-flow will likely improve but per the London Stock Exchange’s free-cash-flow estimates, the FCF estimate for 2023 was $32 billion and it ended at $28 billion. (LSEG is the former Refinitiv, and Thomson, and is this blogs source for EPS, operating income and revenue estimates.)
AI could further complicate free-cash-flow in the next few years, given Meta’s and Microsoft’s capex guidance. To my knowledge we haven’t yet heard from Amazon management on how AI will impact forward capex, and forward capex directly influences free-cash-flow.
Morningstar has a fair value on AMZN of $185 or about where the stock trades today, while the internal model values Amazon around $230 per share.
Technical look at AMZN:
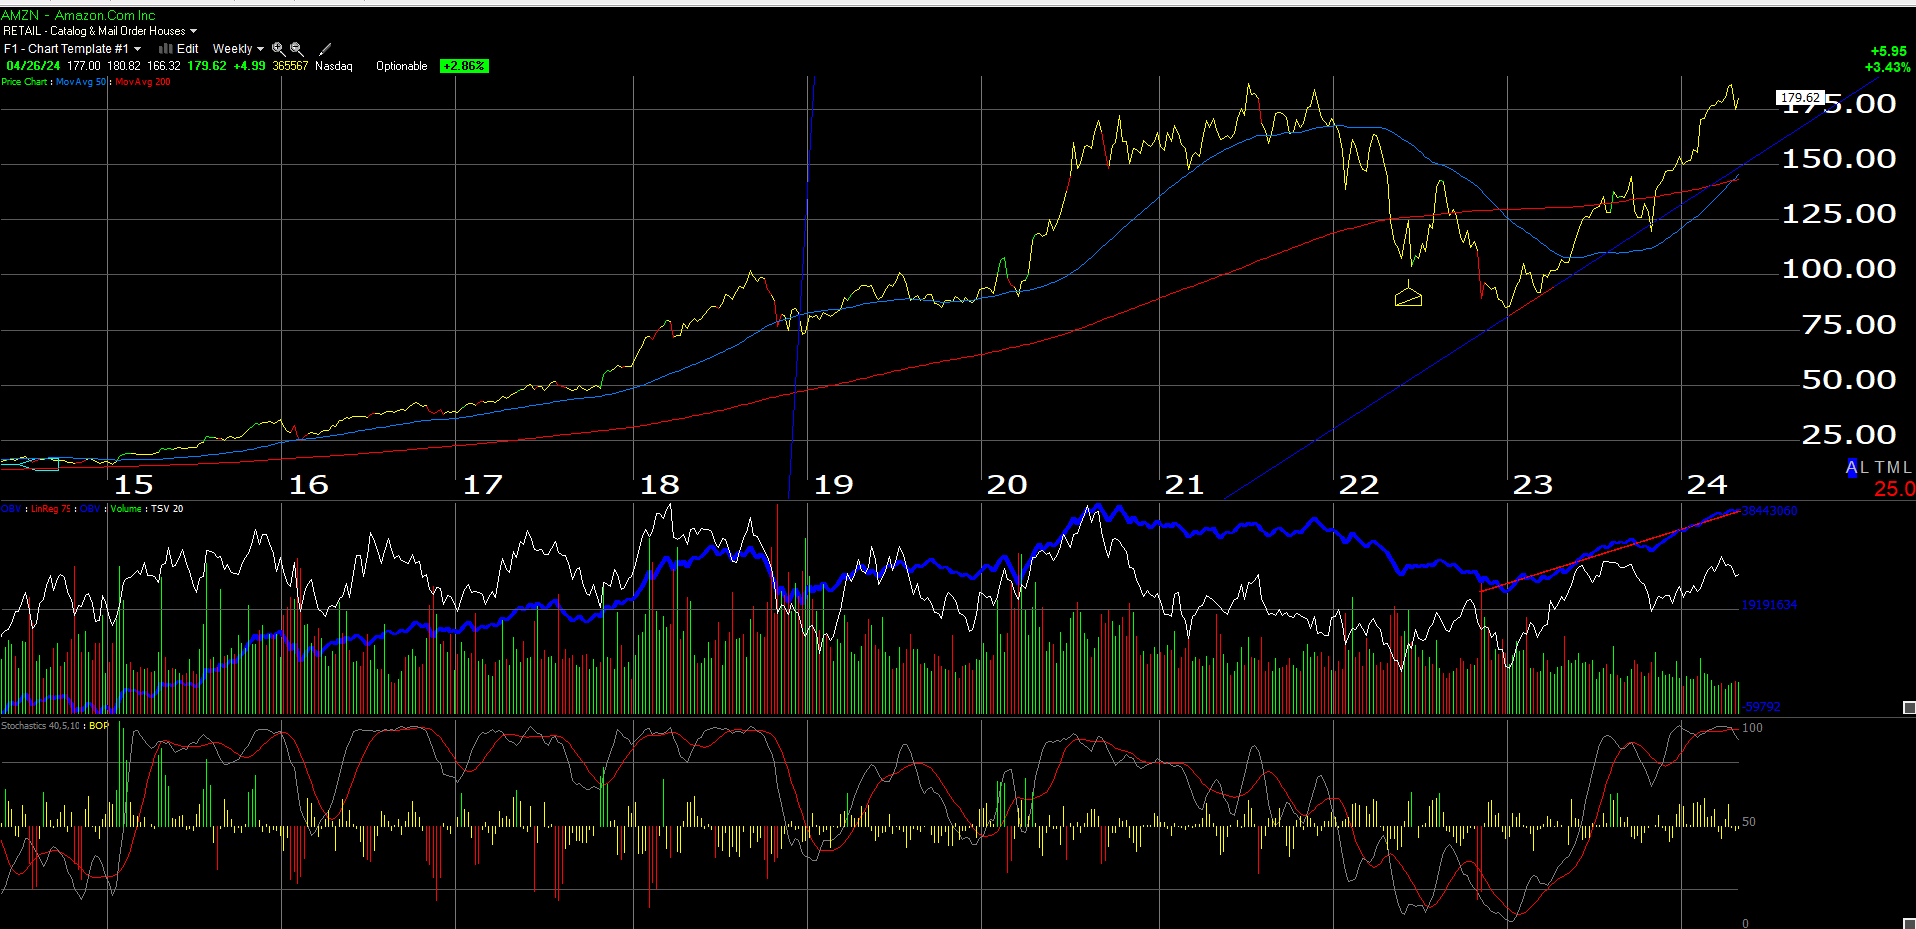
Here’s a weekly chart of Amazon and it’s overbought headed into Tuesday night’s earnings report.
Readers should focus on the after-market reaction and whether the stock can close above $190 on Wednesday, on heavy volume. That would likely indicate a breakout.
It’s been a mixed-bag for mega-cap earnings: Microsoft’s quarter looked good, but the stock closed Friday well off it’s highs. Fortunately MSFT held up despite the significantly higher capex guidance for 2025. Perhaps MSFT investors should feel fortunate the stock didn’t trade like META.
Retail is expected to be a big beneficiary of AI and its adoption. AWS and Stores are expected to see the biggest AI focus for Amazon according to the Q4 ’23 conference call notes found on the website.
Summary / conclusion: Because of the importance of the 4th quarter to Amazon’s annual results, the first quarter is typically pretty average in terms of yoy growth in revenue, operating income and EPS.
The consumer is still robust, AWS is showing improving margin and revenue trends, maybe more so with AI and the advertising business has shown faster yoy growth in the last 5 quarters.
Frankly, AMZN looks fine coming into the Q1 ’24 results, other than the chart being overbought.
Amazon has long been a top 10 holding and currently represents a 5% weight in client accounts, when looking at all accounts as one single portfolio.
The biggest risk is obviously revenue growth for the ecommerce giant, but AMZN looks to be trading off slowing revenue growth for margin gains. The physical stores remain a struggle. I want to shop at Amazon Fresh stores more, but just don’t get around to it.
The biggest positives in my opinion are the turnaround in AWS the last 3 – 5 quarters and the growth in advertising. Although it’s not disclosed (to my knowledge) I suspect advertising revenue is “margin-rich” business relative to the rest of the model.
It would be nice to see Amazon breakout to an all-time-high as GOOGL did last week, and I thought MSFT would too after their quarter, but don’t be surprised if AMZN chops wood for another quarter or two.
None of this is advice or a recommendation. Past performance is no guarantee of futures results. Investing can and does involve the loss of principal even for short periods of time. All EPS and revenue data is sourced from the LSEG.com (London Stock Exchange Group).