SP 500 data:
- The forward -quarter SP 500 EPS estimate this week (data is of Wednesday, 3/20 last week, as LSEG did not publish on Friday, 3/22) was $242.89 down from last week’s $243.31 and January 1’s $243.98;
- There wasn’t that much erosion on the forward estimate over the last 90 days, which is typically a plus. Factset data has noted over the years, that the typical EPS erosion for the quarter next to report is usually 3% – 5%, while the forward 4-quarter (FFQE) estimate erosion since early January ’24 is lower by less than 1%.
- After last week’s 2.5% rally in the SP 500, the PE ratio this week ended at 21.5x versus 21x last week 21x from early January ’24.
- The SP 500 earnings yield ended at 4.64%, down from 5.19% to start the quarter. The SP 500 earnings yield fell almost every week in Q1 ’24.
- The Q4 ’23 bottom-up SP 500 EPS estimate has risen from $54.69 in early January ’24 to $57.11 as of this weekend;
- The Q1 ’24 bottom-up SP 500 EPS estimate will start the Q1 ’24 around $54.90 – $55 per share.
Remember this data does not contain Micron Technology (MU), Nike (NKE) or Fed-Ex (FDX) from last week.
What’s Q1 ’24 Look Like ?
Source: LSEG earnings scorecard
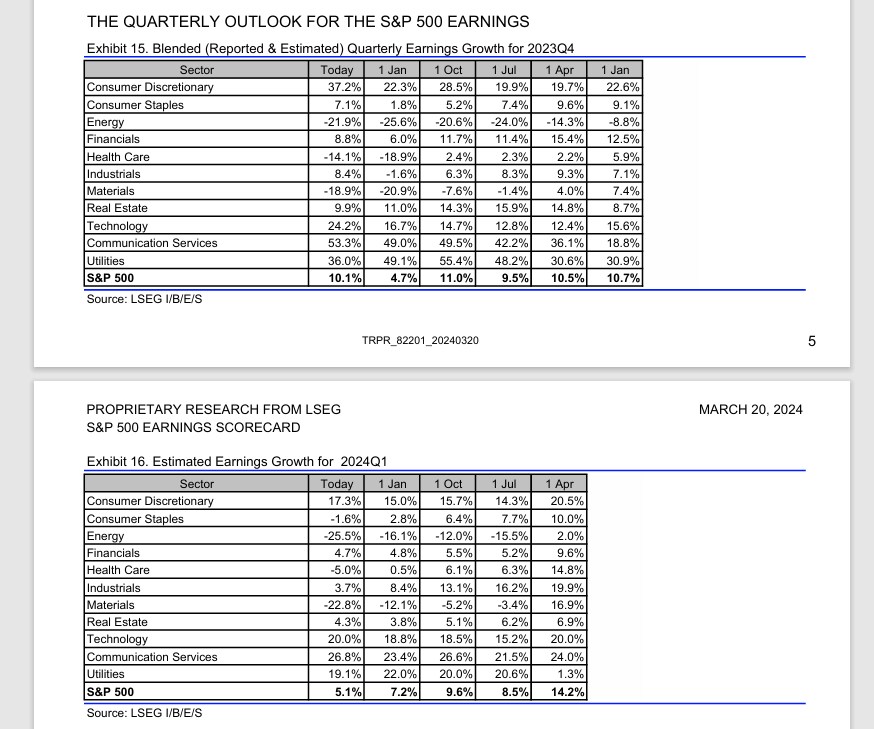
The above cut-and-paste from LSEG’s “Earnings Scorecard” shows the progression of expected SP 500 sector EPS growth.
Pay attention to the last 3 months for each quarterly table.
For Q4 ’23, there was sequential improvement in sector earnings growth for all but the utilities and real estate sectors.
The sectors with the biggest sequential improvement over the 90 days in Q4 ’23, were consumer staples, consumer discretionary, industrials and technology. (This is based on actual earnings results, not the usual estimates.)
Now for Q1 ’24, which is what the vast majority of the investment community worry about today, the normal pattern is to show negative revisions up until earnings begin, so which sectors look the best (?):
- Consumer discretionary has actually seen positive revisions in it’s growth rate the last 90 days: that’s a plus. That is not that common.
- Real Estate is the same – it too has seen a slightly positive upward drift in it’s expected growth rate;
- Technology: has also seen it’s expected growth rate revised from 18.8% to 20%. That too is a plus;
- Communication services: also positive revisions.
Readers should reasonably expect solid Q1 ’24 earnings results from the SP 500 when earnings begin around April 10th, with the financial sector. The financial sector expected EPS growth rate shows a mild reduction in expected growth rate from 4.8% to 4.7% in the last 90 days, which is a good sign for financial stocks, which have suddenly found a bid in the last few weeks.
Technology, consumer discretionary and communication services, comprise 50% of the SP 500 by market cap, as of Wednesday, March 29th, 2024.
Q1 ’24 revenue expectations (ranked highest to lowest in terms of expected revenue growth):
- Real estate at +6.9% expected revenue growth;
- Communication services at +6.5% expected revenue growth;
- Technology at +6.4% expected revenue growth;
- Health care at +6.3% expected revenue growth;
- Consumer discretionary at +5.4% expected revenue growth;
- Industrials at +3.2% expected revenue growth;
- Financials at +2.3% expected revenue growth;
- Consumer staples at +1.5% expected revenue growth;
- Utilities at +-0.6% expected revenue growth;
- Energy at -4.7% expected revenue growth;
- Basic materials at -4.9% expected revenue growth;
- SP 500 +3.3% expected revenue growth;
(Since LSEG did not publish the March 22 “This Week in Earnings” (TWIE) the above growth rates are from March 15 ’24 TWIE.)
Note the two lowest sector growth rates are commodities, i.e. basic energy and materials. Could be facing tough comp’s from last year.
The fact that tech, consumer discretionary and communication services are three of the top 5 sectors, bodes well for Q1 ’24 earnings and revenue growth.
I’d prefer to see lower expectations and thus easier “upside surprises” but Q1 ’24’s results should be just fine.
No warnings flags here yet for Q1 ’24 earnings.
Summary / conclusion: This blog will take another look at the numbers at the end of next week, with quarter end on Friday, March 29th, 2024. It shouldn’t likely change much though, with Micron Technology and FedEx showing decent results.
There seems to be a constant litany of negative earnings prognosticators, quarter in and quarter out, but with the US economy in reasonably good shape as judged by the jobs numbers (including jobless claims), readers should reasonably expect the SP 500 earnings to remain in the 5% – 10% growth range, as long as the economy stays on the path it’s been on since 2022.
It’s a good economy, don’t complicate it.
SP 500 Q4 ’23 earnings were supposed to grow 4% as of early January ’24, and instead wound up +10.1% as of this week. That’s a healthy upside surprise and that upside will likely temper some going forward, but don’t look a gift horse in the mouth.
It’s the earnings patterns that count as much as the actual growth rate changes. In the final 90 before a quarter reports, the typical trend is to see lower revisions as analyst’s become more cautious, hence, when analysts are raising expected growth in contrary to the typical pattern, it tends to be a positive tell.
As of yet there aren’t very many red flags around SP 500 earnings.
None of this is advice or a recommendation. Past performance is no guarantee of future results. Investing can involve the loss of principal even over short periods of time. All SP 500 EPS and revenue data is sourced from LSEG.
Thanks for reading.