With the FOMC meeting announcement this coming Wednesday, March 29th, 2024, and Wall Street and the investment community still talking potential interest rate cuts, it can’t be helped but think of the old Indianapolis Colts head coach, Jim Mora, ranting about, “Playoffs ? Don’t talk about playoffs… Playoffs ?” The prospects for the Colts making the playoffs under Mora given the way they were playing, is about as solid as the FOMC reducing the fed funds rate in the next few months.
Wall Street, the financial media, and the investment community were wrong about the 2023 economic slowdown and “recession”, (and very badly at that) and now seem to be greatly over-estimating the prospect for interest rate reductions in 2024.
Only Jim Bianco of Bianco Research, and John Silvia of Dynamic Economic Strategy have been skeptical of expectation of fed funds rate cuts in March, etc. Jim Bianco’s work can be found on X at @BiancoResearch, and I’ve tried to link some of John’s articles and frequent updates but there is no discernable link. John Silvia was Chief Economist at Wells Fargo, from 2002 to 2018.
The contrarian inflation perspective: 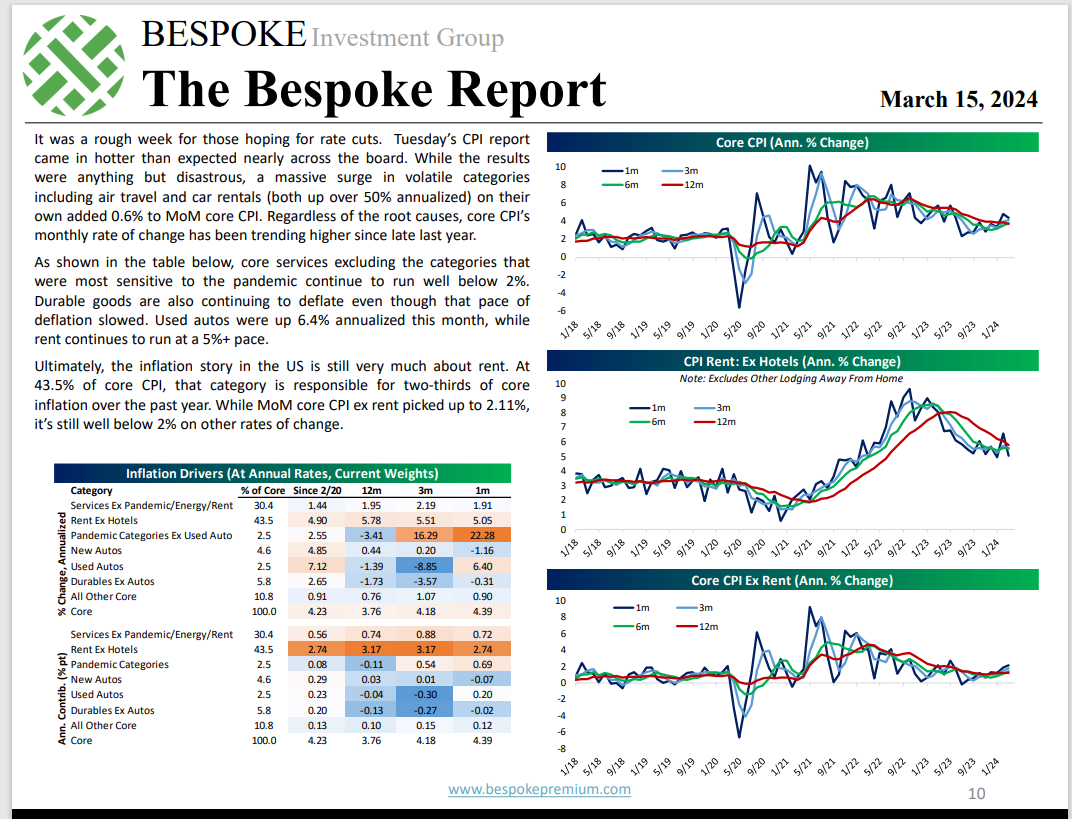
The move in the 10-year Treasury yield jump to 4.3% as of Friday, March 15th, was not really unsurprising given the inflation data this past week. What was surprising was to see this set of tables and charts from the Bespoke Report published 3/15/24, showing that inflation drivers – absent rent – continue to indicate core services (if I’m reading it right) much more sanguine on inflation, than I would have expected. (What I love about Bespoke Research, is not just the scope of their research, but the depth and detail that they publish. )
Last week, it was noted on this blog that Kathy Jones, Schwab’s Chief Fixed-Income Strategist, wrote that, “the BLS was looking at their rent calculation in the CPI” which you would think would mean that the BLS is starting to question whether the CPI “rent” component is being accurately measured within the CPI.
All of this remains part of the inflation narrative, and the mainstream media seems to be tilted bearishly, but I put a lot of weight on Bespoke’s analysis.
Bond market “annualized” returns:
When the US planes hit the World Trade Center towers on 9/11/2001, Alan Greenspan was out of the country and Roger Ferguson, then Vice-Chair of the Federal Reserve, had to cut the fed funds rate to zero, when the stock and bond markets re-opened after that closure. The fed funds rate was reduced to zero again after 2008, that lasted until Q4 ’16, and then the fed funds rate was cut to zero again in March, 2020, with the pandemic and stay-at-home order, which lasted until March ’22.
Look at these annual returns for the various bond market asset classes:
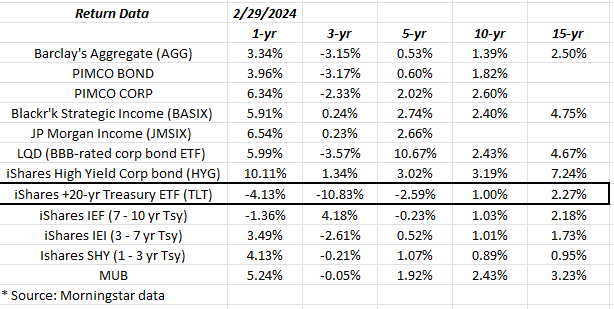
Note the TLT or the iShares +20-year Treasury ETF, which is highlighted in black border. You have to go back 10-years to find a positive annual return for the ETF.
Look at the 2nd numerical column: the “3-year” return. Only 2 of the 12 ETF’s or funds have a positive return for the 3-year time period.
Is an examination of bond market asset class annual returns, leave the reader more bullish or bearish interest rates ?
Summary / conclusion: Bespoke’s analysis of inflation and inflation drivers noted above made me a little more comfortable that investors may not need to worry about a 5.5% 10-year Treasury yield, and an SP 500 trading at 15x in the near future, but the only opinion that really matters is Jerome Powell’s this coming Wednesday, March 20th, when the FOMC meeting announcement is released.
Between 2008 and March ’22, the fed funds rate was sitting at zero for all but 3.5 years (December ’16 through March ’20) which is a long time to suffer through a zero fed funds rate, but it’s probably indicative of the shock the 2008 recession meant to America consumers.
What I worry about is that 2020 through 2029 is as bad a decade for bond market returns as 2000 to 2009 was for stock market returns, and that’s always a very tough prediction to make.
In a strategically-allocated portfolio, i.e. 60% equity, 40% fixed-income and cash, with part of the 60% equity being international investments, only the US large-cap equity exposure is contributing positively to portfolio returns. High-yield credit is up 10% in terms of it’s “1-year” return, but high-yield’s normal weight in a fixed-income allocation is typically 15%. International and non-US investments are returning more in line with small-caps, and the Russell 2000.
None of this is advice or a recommendation. Past performance is no guarantee of future results. Investing – even over short time horizons – can involve loss of principal. All “annual” or annualized returns are sourced from Morningstar. Readers should gauge their own comfort with portfolio volatility and adjust accordingly.
Thanks for reading.