The big reversal in Nvidia got a lot of attention on Friday, as the market darling closed down 5% on heavy volume. As of Friday morning, March 8th, 2024, Nvidia was up 17% in the last 5 trading days and as of the start of the day, was 42% above it’s 50-day moving average, (all of this sourced from Bespoke).
In terms of YTD returns as of March 8 ’24, Nvidia (NVDA) was up 76.75%, while the semiconductor ETF (SMH) was up 28.66%.
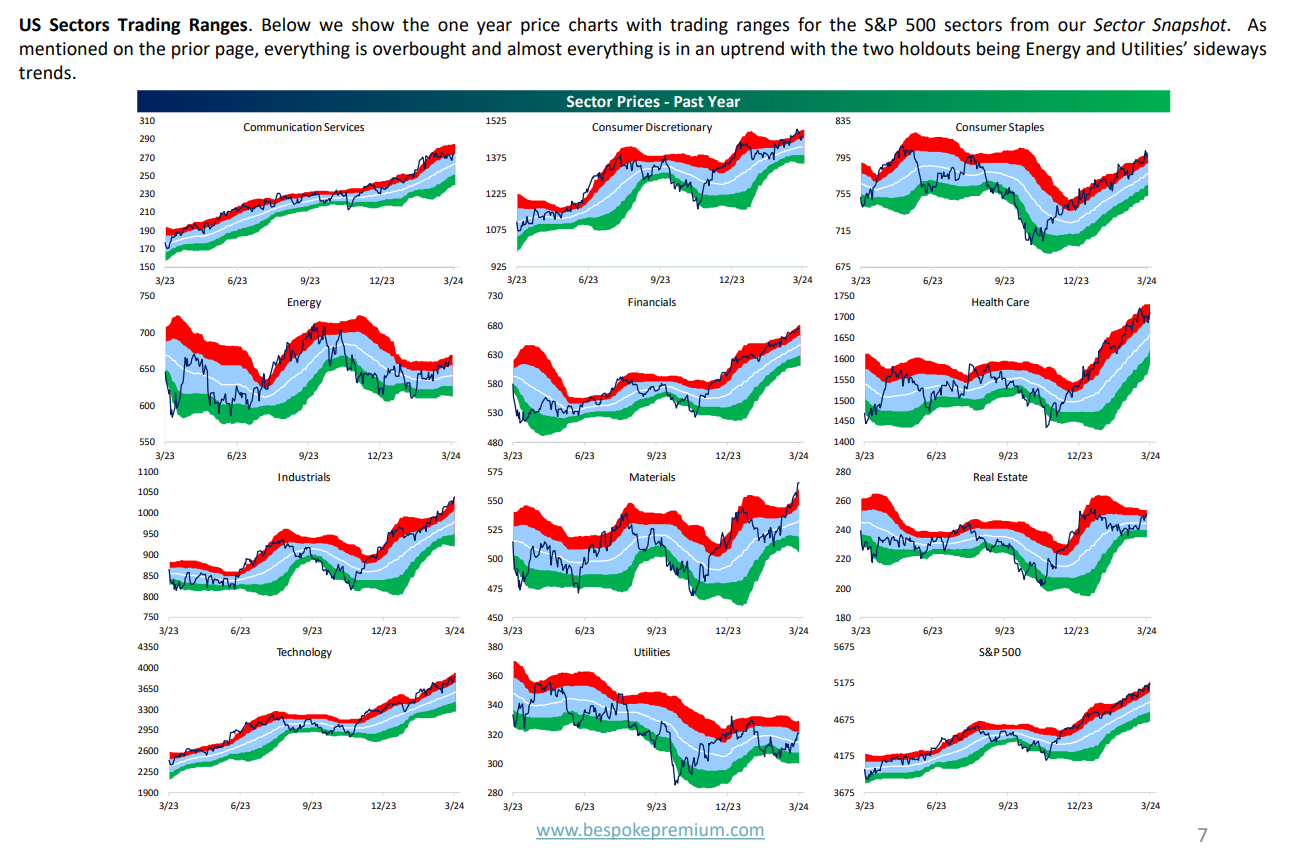
The problem for the SP 500 is, everything seems overbought, if you scrutinize the above sector snapshot from this weekend’s Bespoke Report.
- As of Friday, March 8th, the SP 500 was up 7.79% year-to-date (YTD).
- The Barclay’s Aggregate was down -0.40% YTD;
- The balanced 60% / 40% portfolio was up 4.44% YTD;
In terms of the sector ETF’s, the two sectors beating the SP 500 YTD are technology (XLK), +9.41%, and Communication Services (XLC), which you’d think is primarily META, is up 10.26% YTD.
Financials and Healthcare are both +7% YTD, pretty close to the SP 500’s return.
What surprised me looking at all the numbers i.e. YTD returns, was the Nasdaq 100 was up just 8.84% YTD, or just 95 basis points better than the SP 500. The fact that the financial sector – at least as measured by the XLF – was up over 7% YTD, surprised me too.
Mega-cap Growth (MGK) is up 9.06% YTD.
If you would have asked me to guesstimate the Mega-cap growth, or Nasdaq 100, or other tech index returns, just from the financial media headlines, I probably would have guessed higher returns YTD, but that’s why this exercise is done every weekend, i.e. tracking a list of 100 – 120 individual stocks and sectors, (and funds) YTD returns.
Another surprising datapoint was that high-yield corporate bonds (HYG) had a 1-year return as of 2/29/24 of 10%. HYG as of Friday, March 8th was up 1% YTD. Credit risk has performed well for bond investors in 2023 and thus far in ’24.
Economic Calendar:
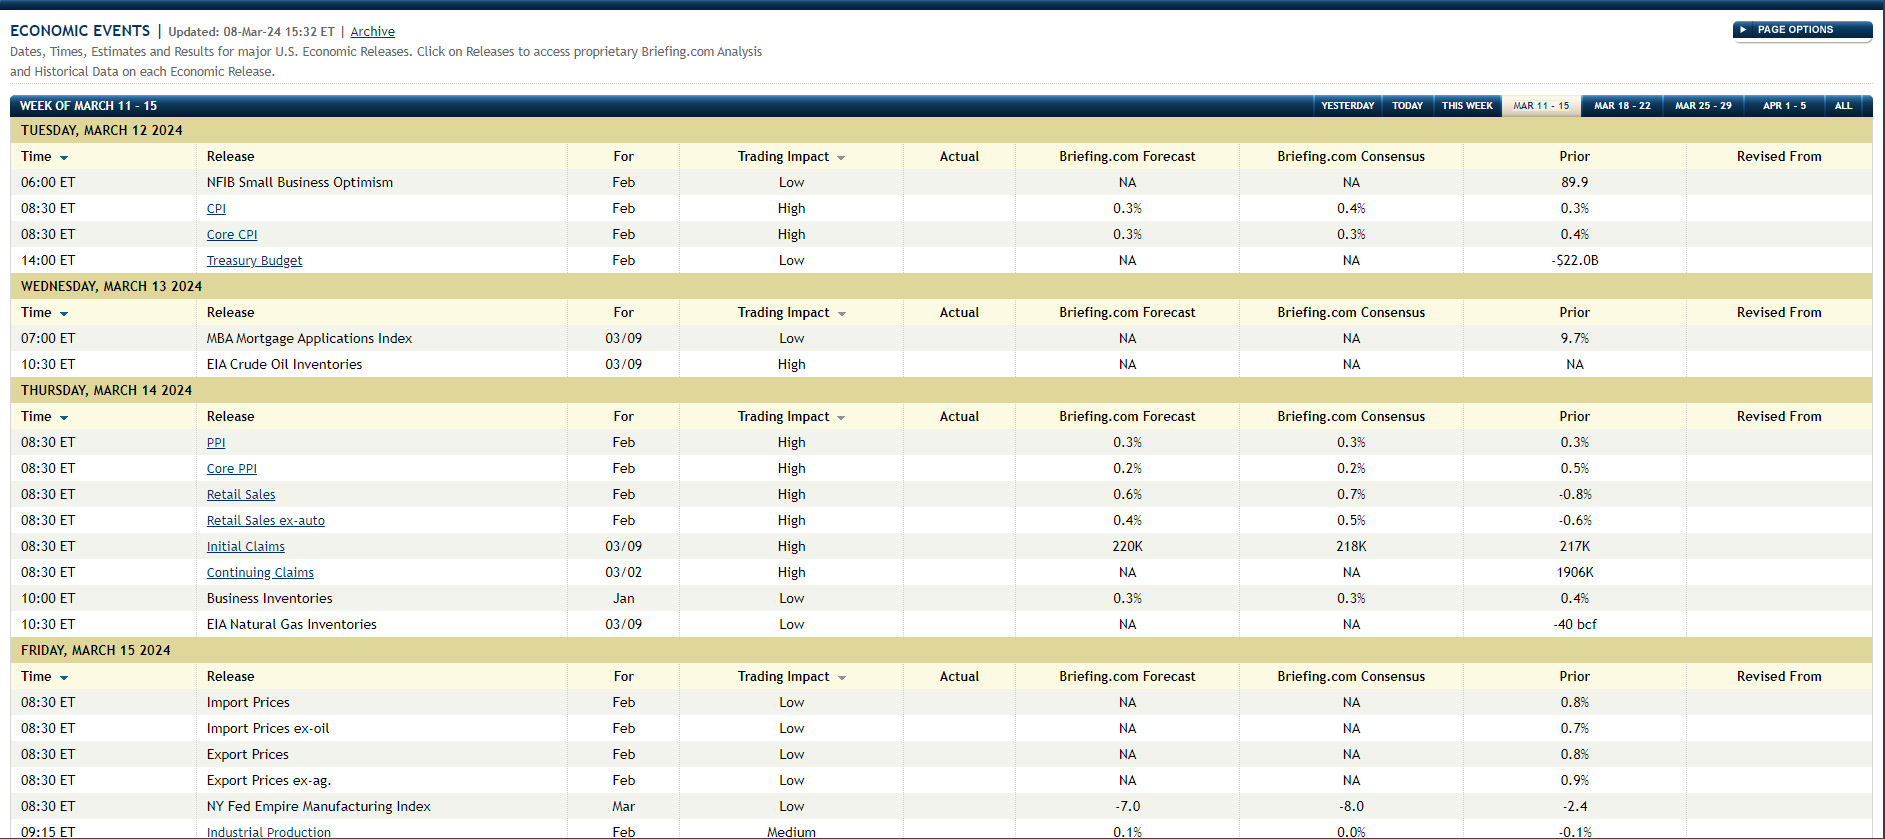
The weekly economic calendar from Briefing.com shows CPI and Core CPI expectations for Tuesday morning, are both +0.3%, which is somewhat surprising given the sharp jump in gasoline prices in the last 30 days.
Given the sharp increase in gas prices at the pump, the expectation was to see a little hotter overall CPI, but that’s not the case. Maybe some think +0.3% is “hot” or warmer and would like to see +0.2% or lower,
PPI is due Thursday, and the January core PPI was well above expectations at +0.5%.
It was interesting that after the January PCE data, that Kathy Jones of Schwab, who is Schwab’s Chief Fixed-Income Strategist, noted that the BLS (Bureau of Labor Statistics) was “looking” at it’s rent calculation in CPI. After last Friday’s revisions to the January ’24 business / nonfarm payroll survey, (as well as December 23’s revisions), you have to wonder how some of this data is calculated. The revision to the January ’24 “job creation” number was a -35% revision, meaning, what was originally thought to be 353,000 was revised downward, removing 124,000 jobs to end up at 229,000 net new jobs created in January ’24. December 23’s number was also revised down 43,000 to 290,000 from 333,000.
As someone who has closely followed and tracked the economic data for most of my professional life, you have to wonder how bad the various government agencies data measurement systems are, to have such large deviations from month-to-month in something as critical as the US payroll report. As a baby analyst in the early 1990’s when you studied the data collection process (and all the agencies disclose how they collect the economic data), the nonfarm payroll survey was a mailing that went out to US corporations, but the data was compiled only in the first 10 days of the month being measured. The “jobs” report is really two surveys – the business and the household – and from the business comes the net jobs gained or lost – and from the household survey comes the labor force and unemployment calculations, which is how you get divergent numbers like Friday’s jobs report, with one survey showing strong job growth, and the other survey showing a rising unemployment rate.
Maybe this is already being done to some degree, but wouldn’t the monthly payment of payroll taxes be a better way to measure jobs growth ? Since corporations have to file payroll taxes once a month, why not submit electronically, the number of full-time employees and any change in that number from the prior month ? ( I have no doubt that that is not a new idea, but readers get the point.)
It seems like a strange and antiquated way to measure a $27 trillion economy. My guess is that with the way everything is politicized today, as soon as one Administration says that the way economic data is being measured and reported will change, the other party is going to scream bloody murder.
Summary / conclusion: Nvidia and the semiconductors have captured so much of the mainstream media attention, they seem to be a much bigger part of technology and the stock market than their weight represents. YTD returns for the SP 500 and the Nasdaq 100 indicate a good year is in store for investors if trends continue, but so much of the market is overbought, but today is nothing like the frenzy of the late 1990’s.
The Nasdaq Composite traded and closed over it’s November ’21 all-time-high of 16,212 in February ’24, but as of Friday’s close has now slid back below that support level Friday, March 8th to 16,085.11
Ed Yardeni put out a chart in the last week talking about China’s influence on the US companies from a growth perspective: Tesla, (TSLA), Apple (AAPL), Nike (NKE) and Yum Brands (YUM). Tesla, Apple and Nike are underperforming the SP 500 YTD, and not by a small amount.
A final point for readers is the continuous talk about the Fed cutting interest rates, both in the mainstream financial media and by the Fed itself, if those comments are to be believed. For someone in my position it’s tough to read every speech or comment by every Fed Governor (voting or non-voting) every week. It seems unusual for Fed Governor’s to keep saying – as the media posits – that fed funds rate cuts are coming. Watching the CME Fed watch tool, the fed funds rate cuts keep getting pushed out – first it was March ’24, now it’s July – which is ok, since the economic data doesn’t really indicate the Fed doesn’t need to cut, but I’ve never seen an environment where the Fed seems to be actively promoting a policy that hasn’t yet been implemented. Normally the Fed and the Fed Chair stonewall, until the economic data indicates a change is needed in monetary policy, and then they move.
None of this is advice or a recommendation. Past performance is no guarantee or even a suggestion of future results. Investing can involve loss of principal even over short periods of time. All SP 500 EPS and revenue data is sourced from the London Stock Exchange Group (LSEG), formerly Refinitiv, and before that Thomson. Readers should gauge their own comfort with portfolio volatility and adjust accordingly.
Thanks for reading.