SP 500 earnings kick off with the big banks and financials starting to report next week, with Friday, October 13th, ’23 being the day 4 – 5 bigger financials report, all of which will be covered this weekend.
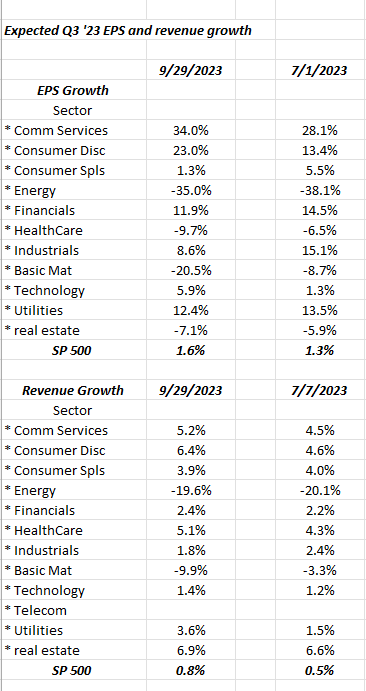
The above spreadsheet table shows what the numbers look like for how Q3 ’23 expected EPS and revenue growth by sector evolved as Q2 ’23 results were reported for the SP 500. (Remember, even though we are in the calendar 4th quarter ’23, we are awaiting results from Q3 ’23 operations.)
What’s interesting is that looking at the bottom half of the above table, 9 of the 11 sectors for the SP 500 saw positive revisions to expected revenue growth for Q3 ’23, with the notable exceptions of industrials and basic materials.
The utility sector saw positive revenue revisions for Q3 ’23 as Q2 ’23 unfolded, even as the common stocks saw a drubbing.
How did Q3 ’22 look a year ago ?
The 3rd quarter ’22 SP 500 EPS and revenue growth were +4.4% and +11.7%. That revenue growth number for Q3 ’22 was the last double-digit percentage growth for the SP 500, after a string of 7 quarters of double-digit revenue growth for the benchmark starting with Q1’21.
The point is, comp’s or compares get much easier for the SP 500 going forward, starting with Q4 ’23. Q4 ’22 saw SP 500 EPS growth drop to -3.2%, while revenue growth was +5.8%.
Looking again at Q3 ’23, technology’s expected growth even for full year ’23 is still hard to reconcile with the so called “magnificent 7” or the top 10 mega-cap names in the SP 500, in terms of their YTD ’23 performance.
The financial sector is still looking for close to 10% EPS growth in Q3 ’23, after printing +9.3% and +7% in Q2 ’23 and Q1 ’23.
All data is sourced from IBES data by Refinitiv.
More to come this weekend.
Thanks for reading.