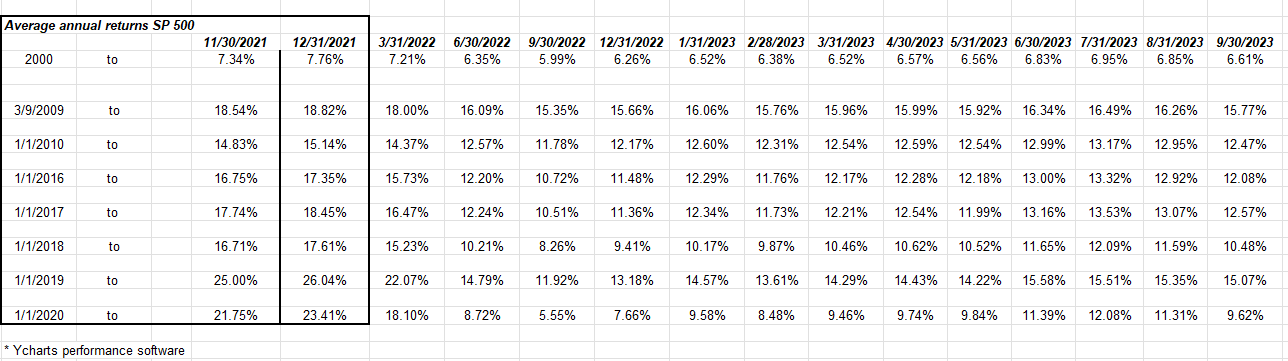
Enlarge the above table, but it gives readers the SP 500 “annual” or annualized returns for various time periods, through 9/30/23.
Since January 1, 2000, through September 30 ’23, the SP 500 has returned 6.61%, which is below average, if we looked at arithmetic returns for the SP 500 since 1970 (discussed below).
What should give readers pause is the annual returns for the SP 500 since March 9, 2009, and then the decade from 2010 through 2020. Those annual return for those periods are above average.
However note that since January 1, 2020, through September 30 ’23, the annual return is back into the high single digits, and probably looks worse after today’s action. That annual return from January 1, 2020 through September 30 ’23 is now below average again.
Bond market annual returns:
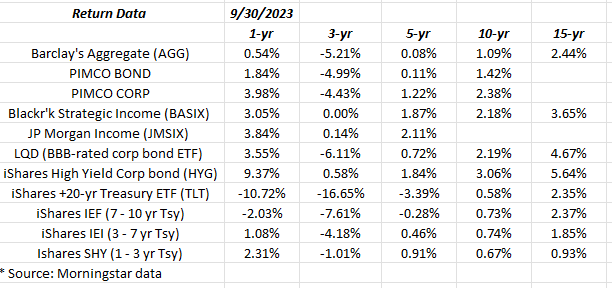
This data set is still a work in progress but the Treasury ETF’s were added as of September 30 ’23.
No surprise that credit risk – HYG and LQD – are winning over duration risk, but at some point that will change.
Those 10-year returns are just barely positive.
Style Box Update:
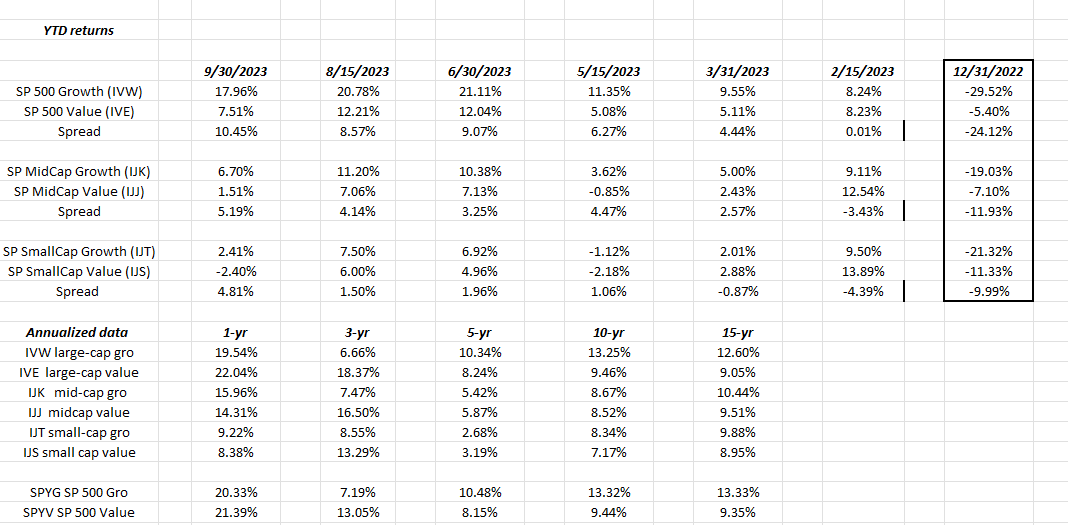
This style box update (top half) shows 2023 returns as well as 2022 returns comparisons on the far right, and then annual returns in the lower table.
It’s still growth over value in ’23 and large-cap over the smaller cap universe.
3-year returns shows value outperforming growth, probably thanks to the energy sector.
Summary / conclusion: Since this data is updated every 6 weeks, it may as well be written about since writing helps absorb and analyze the data. Readers can take what they wish from it.
The SP 500 annual returns are interesting: using the old Ibbotson data (Ibbotson was acquired by Morningstar years ago, which was a smart move by Morningstar), if we simply plotted the SP 500’s annual return since 1970 or for 53 years, the arithmetic average is 11.89%, which is almost half the SP 500’s annual return since January 1, 2000, of 6.61%.
One argument for the SP 500 still being in a secular bull market is that we are still working off the 2000 to 2009 decade’s returns.
The trend in the 10-year Treasury yield is not helping the SP 500. Talk about a wet blanket.
Take all of this as one opinion. Past performance is no guarantee of future results.
Thanks for reading.