This coming Friday, July 14, ’23 we’ll see the financial results for a number of banks and other financial services firms. (See this blog post from earlier this weekend.)
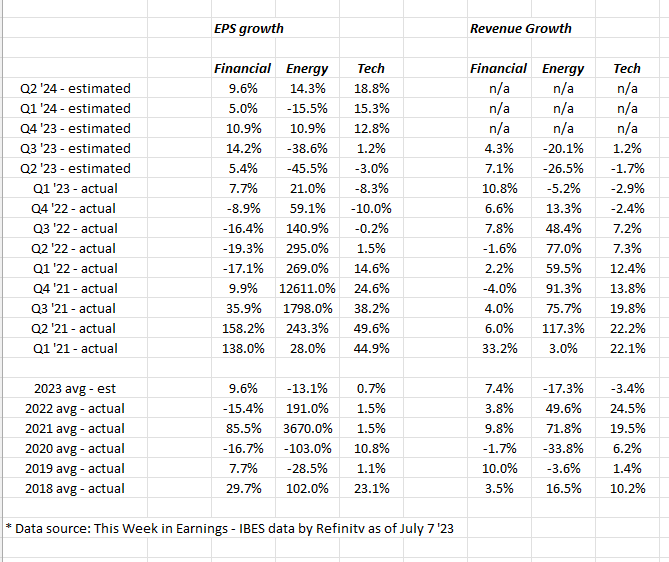
The above spreadsheet details the expected and historical EPS and revenue growth for 3 sectors within the SP 500: technology, financials, and energy.
The bottom third of the spreadsheet shows “average” historical EPS and revenue growth for the sectors going back to 2018, since I wanted to show readers both “pre-Covid” and “post-Covid” growth rates for sector EPS and revenue growth.
A couple of thoughts for readers:
1.) The “pandemic” influence will ripple through the SP 500 numbers through the end of 2023. Using percentages, rather than a dollar EPS figure for sector EPS growth, creates these huge swings in the numbers – particularly for energy and financials – but crude oil fell to below $10 per barrel in 2020 and crude oil futures (delivery prices) even went negative during the early part of the pandemic in 2020 and thus it takes time to “normalize” these growth rates for investors. Financial sector earnings were impacted by the huge loan loan-loss reserves taken after the pandemic in the last three quarters of 2020, only to see those loan-loss reserves get added back to earnings in 2021;
2.) Use revenue growth to get a better idea for what a normal or “average” quarter looks like for the financial and energy sectors. The bottom third of the above spreadsheet shows what EPS and revenue growth “averaged” for all three sectors prior to the pandemic;
3.) Both the financial and tech sectors face weak compares from late 2022, while the energy sector faces stronger compares and good growth from late 2022. Energy saw good volume and higher stock prices late last week in terms of trading, so investors might be looking ahead into early 2023 already.
4.) While IBES and Refinitiv will provide EPS data looking out 4 – 5 quarters, expected revenue data by sector is only provided for the current quarter and the next quarter.
Summary / conclusion: This blog tracks the quarterly EPS and revenue growth rates going all the way back to 2010 or so, and yet it’s not meaningful today to show the historical data, because the Covid / pandemic influence on the various sector growth rates is still impacting the data.
It occurred to me when writing this that it might make more sense to show all 11 sectors of the SP 500 in the above format, but show the data as both “pre-pandemic” or pre-2020 and then 2020 and after.
However given that Q2 ’23 earnings start this week with the banks and financials starting to report, it was thought investors would benefit from seeing the quarterly estimates.
There are more positives than negatives to the financial sector right now, even though the inverted yield curve is a big negative. Financials tend to really outperform when the yield curve is positively sloped i.e. short-term interest rates are lower than longer-term interest rates.
No question with mega-cap outperformance, there will be an intense focus on the technology sector’s numbers. IBM is the first major tech company to report earnings and that’s not until Wednesday, July 19th, after the closing bell. Intel usually reports earlier too but they aren’t scheduled to report their Q2 ’23 numbers until July 27th, 2023.
Take all this as one opinion. Past performance is no guarantee of future results. Investing can involve loss of principal. None of this is advice, since the numbers and the capital markets can change quickly. All SP 500 EPS and revenue data is courtesy of IBES data by Refinitiv. The goal is always to provide relevant fundamental and technical data, although the data is isn’t always updated, and if updated, may not be done in a timely fashion. Readers and investors should gauge their own tolerance levels for market volatility, and adjust accordingly.
Thanks for reading.