Channeling my inner Harry Markowitz (that’s a joke by the way, referencing the seminal mean – variance work Markowitz did at the University of Chicago in the late 1950’s), one of the aspects to portfolio construction that I’ve been discussing with clients is to keep tracking and gradually inserting into portfolios, underperforming stocks, and asset classes that have lagged the SP 500 during this bull market since March, 2009, and longer.
In discussing portfolio construction with clients, the client gets “risk vs reward” (or they say they get it, but I never know). The Wall Street Journal ran an article in the late 1990’s talking about “volatility” and how back then investors didn’t care much about volatility, until they realized after March, 2000, that markets can go down a lot, and not bounce for a very long time.
What clients may not intuitively understand is “correlation” and I try to raise that with the typical “risk vs reward” discussion.
Here’s a look at some long-term laggards or those stocks / asset classes “uncorrelated” to the secular bull market in the SP 500:
Gold and the GLD:
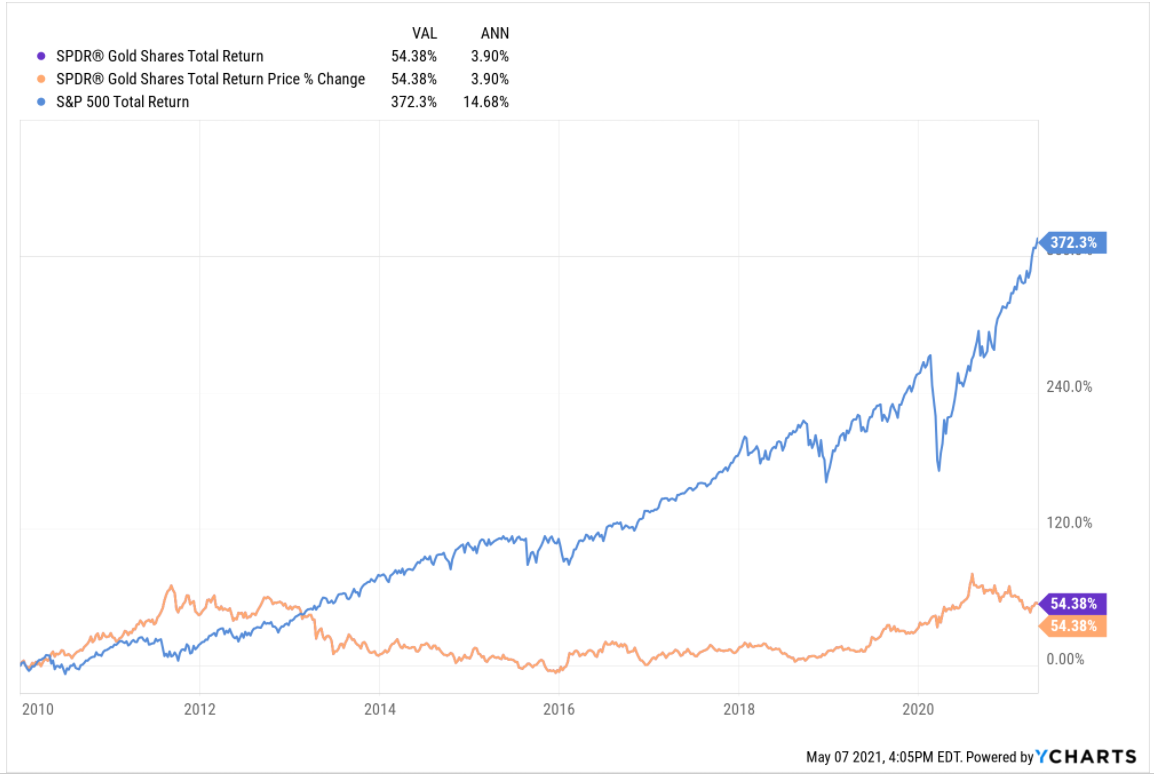
Note the underperformance of GLD versus the SP 500 the last 11 years. Note too that GLD hit it’s all-time-high in October, 2011, at $185.85. It poked above that same level in August, 2020, but fell back.
What drives the price action in gold ? Is it inflation or the weaker dollar or budget and trade deficits or international tension ? Sometimes for short periods its all ove the above. Here is a longer article written late 2020 on gold and the GLD and it’s history. The two big decades of gold outperformance relative to the SP 500 were the 1970’s and the 2000 – 2009 period. Owning gold and the GLD generated massive alpha relative to the SP 500 from 2000 to 2009.
GLD’s performance relative to the SP 500 from 2000 to 2009:
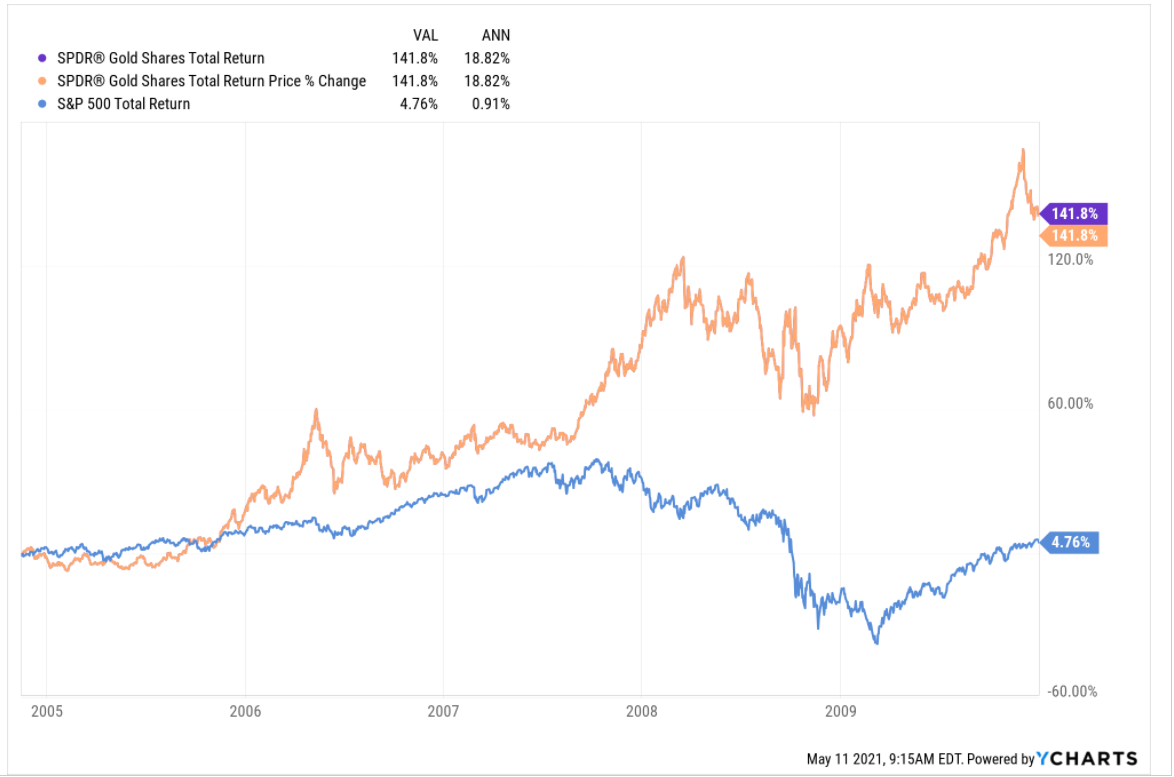
If you believe that the SP 500 is poised for a secular bear market, then GLD can be a great hedge for portfolios.
That being said, there is always the possibility that “it’s different the next time”.
Personally I think there is longer to run in the secular bull market in stocks that started in March, 2009 or in 2013, when the SP 500 finally traded over the 1,500 – 1,575 peaks for the SP 500 in March, 2000 and October, 2007 so gold and the GLD may take a few more years to digest the massive rally from 2000 to 2009.
International and Emerging Markets:
This blog tries to write about Non-US markets every few months to both reinforce my own homework on the asset class(es) and stay up to speed on the numbers. Here was a post last August, ’20, when anything not mega-cap Tech and high-beta growth was stagnant, and then again an update on non-US was written earlier this year in January, 2020.
Josh Brown and Michael Batnick, of Ritholtz Wealth Management, who both do a great job with their social media offerings did one of their YouTube or podcasts shows that I caught on LinkedIn, and John noted the returns on Emerging Markets vs the SP 500 since June 30, 2007, or the point where the market was still not yet feeling the earlier stages of the 2008 Crisis.
Check this graph and “average, annual” returns of EM vs the SP 500:
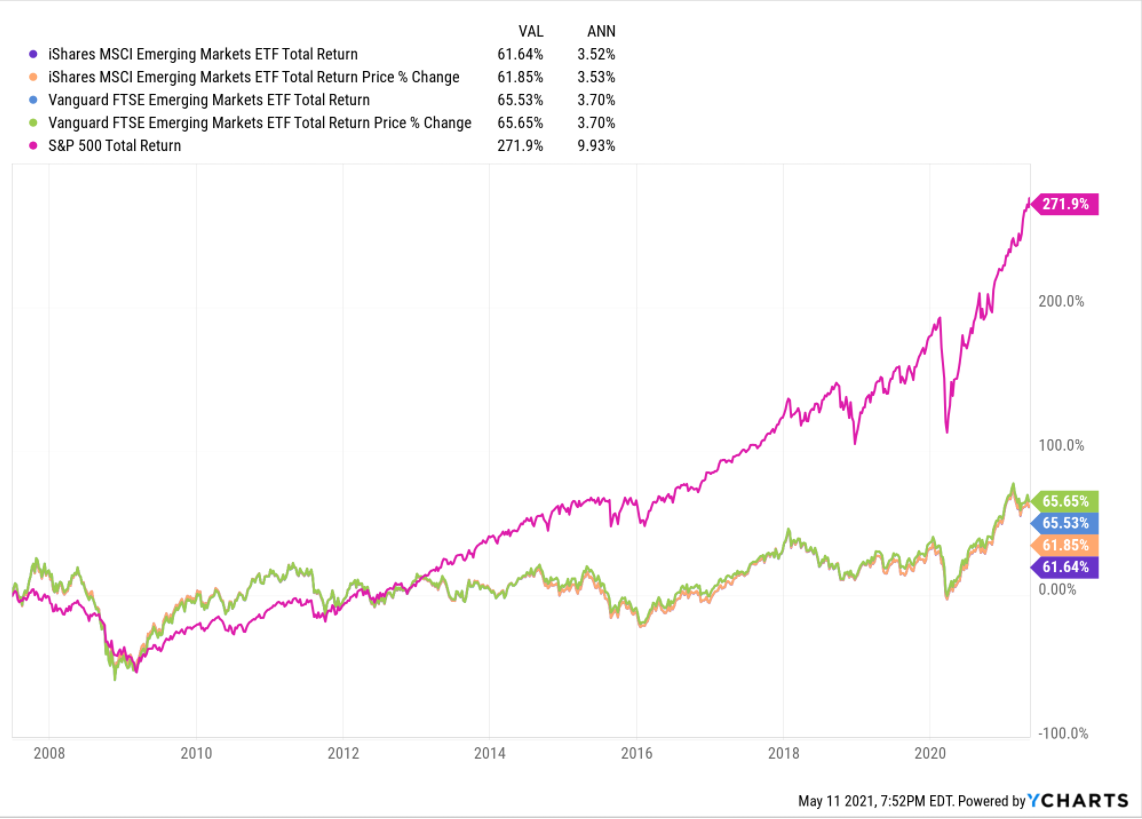
The dollar weakened noticeably last week, but i still think that the whole Alibaba and Jack Ma events earlier in the year where the CCP (Chinese Communist Party) pressured Ma and forced him underground, still might be having a chilling effect on China companies and the desire to own Chinese investments. China is a big part of the Emerging Markets index – roughly 32% – from what I’ve read.
Client weightings continue to grow in EM, non-US via the Oakmark International Fund (OAKIX) and the Van Eck Emerging Markets Fund (GBFAX). I was early in EM starting in Q1 ’16 and then lifting the weight to 5% in 2018, and for most clients today the EM and International weighting combined is between 10% – 20%.
Last year Oakmark International had a tough year: the mutual fund was down 22% as of October 30, 2020, but managed to finish up the year +4%. The fund is up over 13% YTD in 2021. It’s had quite a turnaround after a tough 2020, and it’s 3-year average annual return is under 4% at 3.98%. Id like to see that 3-year average get closer to 10% before reallocating the fund.
Summary / conclusion: Despite the weakness in large-cap Tech and high-beta growth the last 6 months and in 2021, respectively, I’m not convinced the secular bull market in the SP 500 is over, like it was over in March, 2000. Pay attention to the “average, annual returns” across these asset classes though to give you some downside protection in a bear market, and some rotation potential when the SP 500 party finally ends.
The average, annual, return from January 1,2000 through May 10, 2021 is still just 7.07%. Exactly in line with the post WW II average of 7%.
The returns for shorter timeframes are much higher though.
This is the first pass at the “uncorrelated” crowd. More is on the way looking at long-lagging stocks from the 1990’s.
Take everything you read with substantial skepticism, and invest based on your own comfort level for risk of loss and volatility.
Thanks for reading.