This blog has written about the emerging markets frequently over the past few years, and needless to say the asset class has been a frustrating long, underperforming the SP 500.
Clients first trade ever in the EEM / VWO came in early 2016, when the 10-year “average, annual” return for the EEM / VWO fell below 0% to a negative return,
At that time, a 2% – 3% position was bought for clients given that the bull market in the SP 500 approaching it’s 7th – 8th year, off the 2009 low, and some diversification and uncorrelated asset classes were needed. The weighting was lifted in 2018 to a 10% position split between the VWO and Oakmark International, both of which are still held by clients.
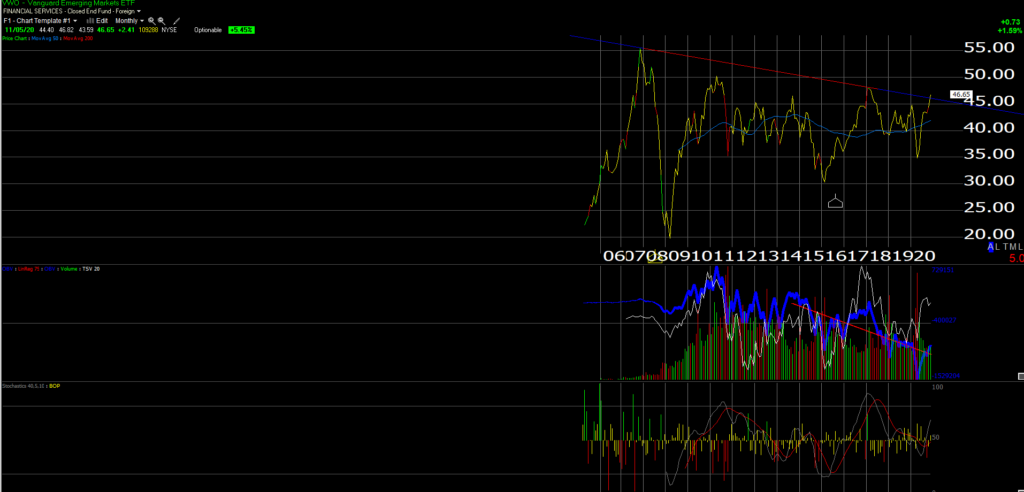
As the above chart shows, the VWO is trading above it’s downtrend line linking the 2007 and 2017 peaks for the first time since – well – ever, as this week saw a nice push higher for the VWO after the election.
Volume has been above-average the last two days.
The narrative around the election is that a President Biden would be easier on China (supposedly) and that would help the emerging markets growth prospects given that huge sucking sound we heard from 2003 to 2007 was China growing at 15% per year, and importing a lot of emerging market resources and product.
As of last night, the VWO was up 4.92% YTD, behind the SP 500’s YTD return of 8.9% after this week’s rally, but the real attraction to emerging markets is the long-term underperformance of EM vis-a-vis the SP 500 from an “average, annual” return perspective.
VWO “average, annual” return over 10 years: +2.06%
SPY “average, annual” return over 10 years: +13.13%
Data source: Morningstar as of 11/4/2020
VWO weekly chart:
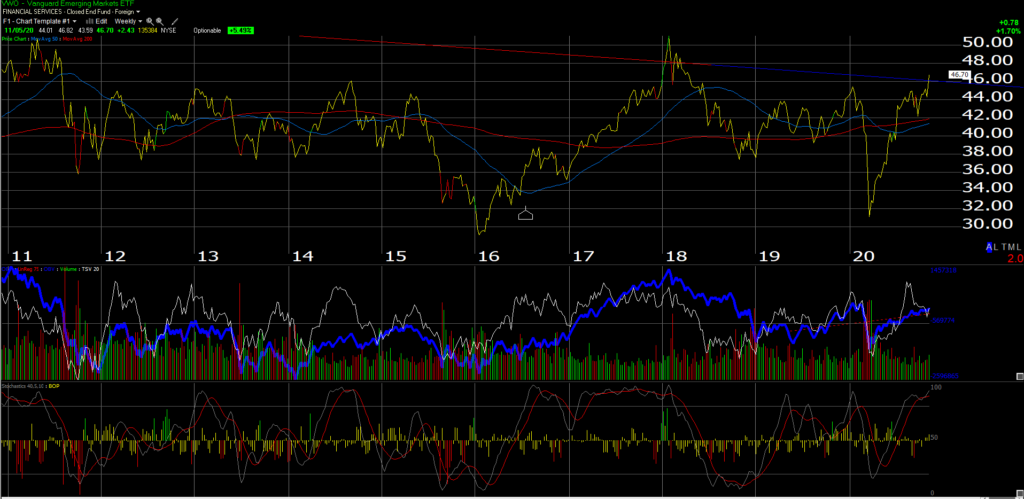
For readers who have to squint too hard to see the trade above the trendline, this weekly chart shows the VWO trading that same trendline.
If readers wish to be patient, the real breakout for the VWO would be above the $55 level, while a trade above $50 would be a plus.
Summary / conclusion: The VWO and EEM are two large emerging markets ETF’s both of which are heavily invested in technology stocks. The VWO has the top 20% of it’s holdings in Tech, with 14% of that 20% being Chinese technology i.e. Alibaba and TenCent as of 9/30/20.
The Oakmark Imternational Fund was down 7% last week, but up 6% for a 1-week return per the Morningstar data. It’s down 17% YTD as of last night’s close. The performance metrics do not look good for Oakmark International with 1-year and 3-year return comparisons putting it in the 99th percentile of the international fund category, of which there are 767 funds.
However that is precisely why the Oakmark Fund is staying in place, since it’s 10-year “average, annual” return is 3.90% also well below the SP 500’s 10-year return.
Back in the 1990’s emerging markets and international became dormant as so manyy other asset classes did during the SP 500 and Nasdaq Composite run from 1995 to 2000. Once large-cap Tech broke in March, 2000, the EM, commodity, China and International asset classes took off, all more or less linked to China.
Will history repeat itself ? I hardly expect an 80% decline in the Nasdaq again, but large cap Tech and the market-cap weighted indices could start to lag and do so for a considerable period of time, and a way to hedge that bet is to own emerging markets and a quality international fund.