Looking over the Bloomberg data updated weekly, it still appears that corporate credit risk is not reacting to the trading range of the SP 500 since September 2nd. Emerging market debt has weakened a little but corporate high yield’s YTD return remains stable.
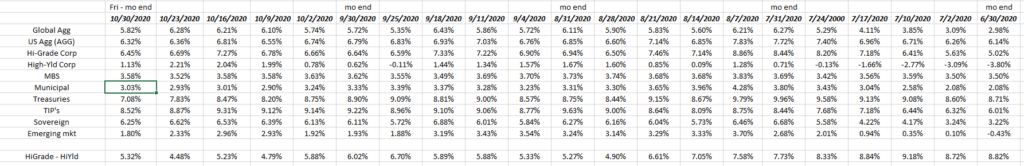
The above data looks back to June 30th, while the SP 500 peaked in early September but as readers can see the YTD returns remain stable.
Investment-grade credit returns have weakened a little vis-a-vis high yield but are still outperforming year-to-date.
Treasury yield curve:
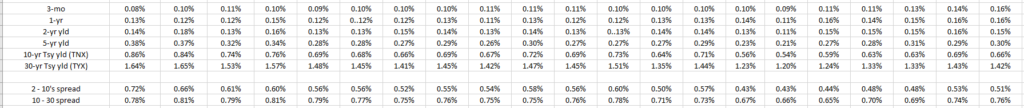
Readers can see how the 10-year and 30-year Treasury yields have widened recemtly vis-a-vis the rest of the curve, and the 10-year Treasury yield even widened this past week, even though the SP 500 fell 5% on the week, and over 2% on the month.
Treasuries typically always find a bid when the SP 500 weakens, so I’m wondering what the message is of the Treasury market today.
The U.S. Department of the Treasury will send you an email every day with closing yields across numerous maturities. All you have to is sign up. I like to log the data every week just to insure I write down the yields and commit them to paper.
Client bond fund returns:
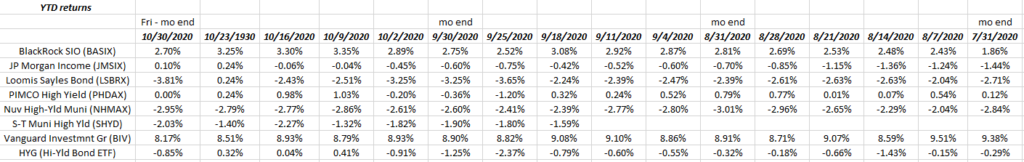
This is a spreadsheet started when Covid-19 hit in early April ’20, to keep an eye on client bond funds and various asset classes.
Client’s top 2 fixed-income funds i.e. the Blackrock Strategic Income Opportunity Fund and the JP Morgan Income Fund have improved nicely since the bottom in March ’20 and since July 31, while Loomis Sayles Bond Fund has lagged a little since July 31.
Since monetary policy is separate from fiscal policy, the bond markets are less affected by the Tuesday November 3, 2020 elections, although corporate credit credit spreads might react to what happens.
Top 10 Holdings as of October 31, 2020:
Microsoft (MSFT) +29% YTD
BlackRock Bond Fund (BASIX) + 2.7%
Amazon (AMZN) +64% YTD
JP Morgan Income (JMSIX) +0.10% YTD
Vanguard Emerging Mkt (VWO) +0.10% YTD
JP Morgan (JPM): -27% YTD
Loomis Sayles Bond (LSBRX): -3.81%
Schwab (SCHW) -12.4% YTD
Nasdaq 100 (QQQ): +27% YTD
Biotech ETF (XBI) +18.7% YTD
Tesla (TSLA): +363% YTD
To determine client’s Top 10 stock positions (excluding bond funds) add Visa (V), SPY and Merck (MRK) to the above.
The portfolio construction goal is to offset some of the Tech momentum names, with the Financial sector stocks, and the Emerging Market (VWO) and Oakmark Int’l fund to arrive at a blend of growth and value. Schwab rose 13% in October largely based on the closing of the TD Ameritrade merger.
Summary / conclusion: Will the election change the Tech and Big 5 market-cap names in terms of return dominance, and breathe life into mid and small-cap and value and non-US asset classes ?
Forecasts and predictions are useless right now, while waiting to see what Tuesday November 3rd and the rest of the week hold is probably the better move.
Take everything written here with a grain of salt and do know that after Tuesday, November 3rd, the credit markets and the equity markets (in terms of winners and losers) could change, and possibly change dramatically.