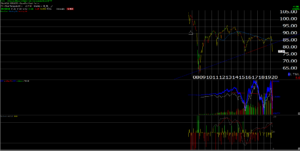
Since last Wednesday night’s April 1, 2020 close, the SP 500 has risen over 11%.
Crude oil bottomed in February ’16 at $28.50 per barrel (?), and I’m not sure if that was WTI or Brent. Today, WTI closed at $26.22 and Brent at $33.69.
The reason crude’s brought up is that the HYG (High Yield ETF) closed back above it’s February ’16 low today.
Energy is 10% of the HYG market cap, so the President’s statements around helping the sector and the jobs therein, matter.
The Fed stimulus is very important also. Clients are gradually seeing their direct exposure to high yield increase but there is no hurry. This will last a few quarters.
CNBC, Bloomberg, Fox – the action is overwhelmingly oriented towards stocks and sectors.
Given the Fed liquidity additions and the Fed stimulus, the real action is in the corporate bond markets today, including high yield.
If corporate bonds don’t work, the stock market won’t work.
—————–
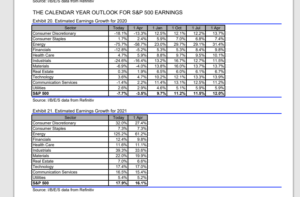
I’m trying to give readers something useful on the SP 500 earnings front, in an enormous sea of uncertainty.
One suggestion for readers (looking at the IBES by Refinitiv data above) to look at “average” SP 500 for 2020 and 2021.
Right now the trough for SP 500 earnings in terms of y/y growth is expected in Q2 ’20. No surprise there. In fact the 3rd quarter, 2020 “bottom-up” EPS estimate just slipped under last year’s (2019) EPS estimate while Q4 ’20’s SP 500 bottom-up EPS estimate remains above Q4 ’19 as of now.
A lot of pundits are calling for $110 – $140 2020 SP 500 EPS (mid-point $125) which I can’t argue with.
What I’m focusing on now and as we move through Q1 ’20’s earnings reports starting next week, is how the relationship changes between the 2nd, 3rd and 4th quarter of ’20 bottom-up estimates change and what happens with 2021.
Note how 2021 SP 500 estimates are already being revised positively (i.e. higher).
We’re all trying to decipher a rapidly moving target.
Remember, 2021 is less than 9 months away.
—————
Top 10 Client holdings and Top 10 Equity Positions as of 3/31/20:
The following were / are the top 10 clients holdings across portfolio as of 3/31/20 and their YTD (thru 3/31/20) returns:
- Microsoft: +0.22%
- BASIX (BlackRock SIO (unconstrained bond fund): -5.92%
- AMZN: +5.51%
- JMSIX (JP Morgan Income Fund): -11.35%
- Schwab: -28.93%
- JP Morgan: -34.77%
- Coke (KO): -19.31%
- QQQ: -10.26%
- VWO: -24.41%
- LSBRX (Loomis Sayles Unconstrained): -11.79%
- Return Source: Morningstar
Top 10 individual equity positions and YTD returns as 3/31/20:
- Microsoft: +0.33%
- Amazon: +5.51%
- Schwab: -28.93%
- JP Morgan: -34.77%
- Coke: -19.31%
- QQQ: -10.26%
- VWO: -24.41%
- Visa: -14.09%
- CME: -13.45%
- XLF: -31.86%
- Return source: Morningstar
Because the blog and the articles for Seeking Alpha are frequently used for writing about securities and sectors where a position might not held for clients at all, or I just want to go through the effort of writing about a company or stock since the article itself is a form of research, I thought it appropriate to show readers positions over periods of time (as was done here and here), since Trinity emphasizes low-turnover, tax-sensitive investing for clients, in taxable accounts. (These previous links were largest equity positions in the past. Going forward both the 10 largest positions and the 10 largest equity positions will be disclosed.)
Microsoft (MSFT) has been clients largest position for over 5 years. Wall Street Transcript did an article on Trinity’s largest positions in Microsoft and Schwab several years ago, and little has changed.
Financials and Emerging Markets hurt this quarter for sure. The dollar remains strong too.
Summary / conclusion: We’ve had a bear market and then a bull market in the last 8 weeks in the SP 500, which is why it’s so pointless (in my opinion) to say a 20% correction (in and of itself) is a bear market. I dont know why CNBC continues to push this notion. If the SP 500 doesn’t make a new all-time-high for 12 months, the mere fact that it didn’t correct 20% mean it wasn’t a bear market ? I remember 1994 and the correction the SP 500 had intra-year and that felt like a bear market for 12 months.
We’ll continue to have more posts on the corporate bond market.
Remember, if credit spreads continue to widen, it won’t bode well for the SP 500’s forward progress.
The corporate and structured credit markets must continue to show slow recovery.
Take all opinions – especially this blog – with substantial skepticism and a healthy grain of salt. A lot of emotion today is Covid-19 related. Continued progress on Covid-19 doesnt mean that we wont see an entire year of SP 500 earnings completely trashed.
Thanks for reading and for all the comments.