Financials start the Q4 ’19 earnings season this week, which is typical each quarter, as Financial’s start reporting and mostly finish reporting before the rest of the SP 500 does their quarterly duty.
The other interesting (and mostly irrelevant) fact about Financials is that there are 66 Financials within the SP 500. Only the Industrial sector has more companies within the SP 500 – 70 – than the Financial sector.
Per the IBES by Refinitiv list, 16 Financials are scheduled to report their Q4 ’19 earnings results this week, with many of the majors – JP Morgan (JPM), Schwab (SCHW), Bank of America (BAC) and Goldman Sachs (GS) getting the Q4 ’19 party started.
While it’s dangerous to generalize too much, the calendar Q4 ’19 capital market conditions were favorable or conducive to generating good results in the FInancial sector.
Here is the usual SP 500 data: (Source data: IBES by Refinitiv)
Forward data:
- Fwd 4-qtr est: $176.71 vs last week’s $176.74 and up from $171 two weeks ago (quarterly bump after Jan 1)
- PE ratio: 18.5x
- PEG ratio: 7x (read below for clarification)
- SP 500 earnings yield: 5.41% vs last week’s 5.46% and the multi-year low of 5.28% on December 27th, ’19.
- Y/y growth of forward estimate: +2.65% vs last week’s +1.84%
This data can get confusing for readers so it bears repeating almost every week: the “y/y growth of the forward estimate” is a measure of the change of the forward estimate this week $176.71 vs the forward estimate 52 weeks prior. Basically this blog is trying to capture the “1-year rate of change” in the forward estimate since a rising rate of change might portend “PE expansion” for the SP 500, while a declining rate of change, which was seen from September ’18 through early November ’19, might portend a stable to contracting PE multiple for the SP 500.
The PEG ratio is dividend by calculating the 18.5x PE for the SP 500 as of Friday, January 10th, 2019, divided by the 2.65% to get a 7x PEG.
Trailing data:
- TTM EPS: $163.08 vs $163.19 the week of January 3rd
- PE ratio: 20x
- PEG ratio: 2.21x
- SP 500 earnings yield: 4.99% vs last week’s 5.04%
- Fwd est divided by TTM est: 8.36% vs last week’s 8.30%
The last bullet point shows the forward estimate divided by the trailing estimate, and that is close to the expected 10% growth in SP 500 earnings for the SP 500 in 2020.
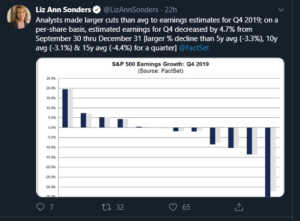
Here is an interesting tweet from Schwab’s LizAnn Sonders that appeared on Twitter on Friday, January 10th, 2020. LizAnn is very good with her prognostications from her perch at Schwab. She was one of the first strategists to turn bearish last September, 2018, just prior to the 20% Q4 ’19 20% correction in the SP 500.
However, here is the weekly data point this blog has been sharing with readers since late November / early December ’18:

This week, the spreadsheet was expanded to show the narrowing or declining “1-year chg %” until the week of 11/1/19 and then that 1-year rate of change has steadily expanded since that week, reaching 2.65% this week.
This is truly geeky stuff.
Does this correlate exactly with SP 500 trading action ? No, certainly not this year, since the Fed and more liquidity and aided the market greatly.
But here is what is interesting: the “1-year % chg” value peaked last year the week of September 21, 2018, at a tax-reform aided 22.92%, the same week the SP 500 peaked before correction in Q4 ’18. Coincidence ? Possibly.
Q4 ’19 EPS and revenue growth estimates by sector:
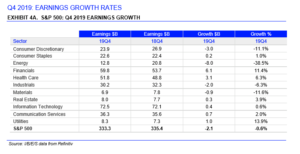
Utilities, Finacials and Health Care have the best “expected” rates of earnings growth for Q4 ’19.
Revenue growth expectations by sector:
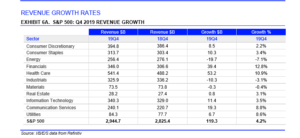
Financials, Health Care and Utilities are the sectors looking for the strongest “expected” revenue growth in Q4 ’19.
Summary / Conclusion: First quarters of each year tend to see weaker guidance and poor action, something that was written about on this blog in February ’19 and in years past. Steve Liesman in a bout of what i thought was good reporting asked the Commerce Department to look at first quarter weakness in GDP a few years back, and given the government and the vagaries of GDP reporting and what can be – ultimately – sizable revisions to economic data, I thought Steve eventually said that Commerce gave him nothing conclusive on the issue.
It does seem from an “estimate revision” standpoint, that given the headlines and the news, negative EPS revisions can outweigh positive EPS revisions, during the first calendar quarter of the year. This blog actually has the data on this going back many years but it would be a horribly bland post and loaded with statistics and not too terribly exciting to read. However the point is that the first calendar quarter of the year – maybe due to tempered full-year earnings guidance for the SP 500 – seems to outweigh other quarters of the year in terms of the negative / positive EPS revision ratio.
Pretty exciting stuff, no ?
What was interesting about 2019 is that the Financial sector had some of the best EPS and revenue growth by sector for the calendar year and yet the flatter yield curve seems to have tempered enthusiasm for the big banks, at least until calendar Q4 ’19. Like a lot of value sectors, Financials rallied into year-end 2019. It certainly helped client performance at the end of last year.
Remember, the worst sectors per the above IBES data – Energy, Basic Materials, comprise less than 6% – 7% of the SP 500’s market cap. Technology, the Financial sector and HealthCare sectors comprise 45% – 50% of the SP 500’s market cap. (The Top 10 stocks in the SP 500 comprise 22 % – 23% of the market cap of the benchmark. Here’s their expected earnings growth rates for 2020.)
I’ve never had success as a commodity investor in Energy names or names like Alcoa or coal, copper or even gold stocks. Long-run returns on capital are very poor and the stocks have tended to be value traps. When these sectors work, they tend to do really, really well over very short periods of time. However Energy sector estimates for 2020 – at least the revisions anyway – have started to turn positive, That hasn’t been seen in a while. (Will revisit that this week.)
The SP 500 earnings yield is still pretty low at 5.41%. The SP 500 bottomed the week of Christmas in 2018 after the SP 500 earnings yield peaked at over 7% the week of December 21, 2018.
Thanks for reading,