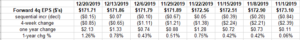
The “forward 4-quarter estimate” in terms of it’s 1-year change % or y/y growth, looks to have bottomed on November 1 ’19. This number has been declining since late September ’18, and peaked the week the SP 500 topped in September ’18.
Moving steadily higher since November 1st is a big plus.
Even 2019’s bottom-up estimate for the SP 500 is moving higher in terms of y/y change:
(Data source: IBES by Refinitiv)
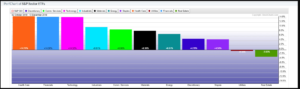
Blaine Rollins, CFA, the premier blogger at @361Capital published graph this last week on SP 500 sector returns:
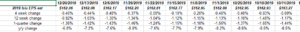
Looking at the 2019 SP 500 estimate, we should expect a decent quarter of earnings growth in Q4 ’19. FedEx (FDX), Costco (COST) and Oracle (ORCL) have all reported their November quarters in the last few weeks. While FedEx is likely a company-specific challenge, both Oracle and Costco have traded slightly lower following earnings, even though forward estimates have risen after reporting their quarters.
Large-cap pharma has been on fire in Q4 ’19 per the @361Capital graph. Merck is prepared to break out of a 20-year base. (Long all stocks mentioned – FedEx update coming.)
Summary / Conclusion: So what’s it all mean ?
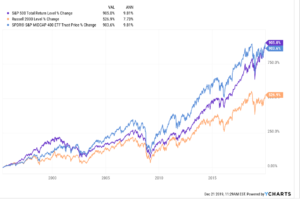
Here are the “average, annual” returns for the SPY (SP 500), MDY (MidCap 400) and the RUT (Russell 2000) from January 1, 1990.
What surprised me is that the “average, annual” return for each is still well below the “average” return for the SP 500, which I calculate at closer to 11% since the early 1970’s.
In addition, the SPY is just now catching up to the Mid-Cap 400 (MDY), in terms of return. I would have thought the SPY would have outpaced the MDY by now.
This is simply one opinion, but I don’t think investors will ever see 2008 again in our lifetime. It was the “Boomer” version of the Great Depression, with housing, credit markets, and the economy (and ultimately the stock market) all collapsing at once. Americans had never seen a national housing depression and an annual decline in home prices nationally – outside of local geographies from the late 1980’s S&L Crisis – ever in the post WW II period.
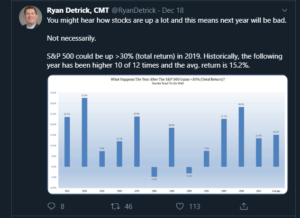
Here’s a chart from Ryan Detrick that supports this blog’s 2020 forecast published last week:
Stock market bullishness has risen the last week, which always makes me nervous.
The hallmark of this bull market since 2009 has been lack of bullishness or skepticism, and good market breadth.
Thanks for reading.