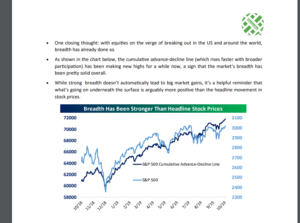
Page 38 of 39 in the Weekly Bespoke Report published Friday afternoon every week, held the best chart of all as it shows the market breadth breaking out ahead of the SP 500.
Sentiment is back to being bullish, so if the pattern holds for 2019, there might be weakness in the SP 500 for the near future since each time the SP 500 has gotten “overbought” in 2019, – i.e. late April, Late July, mid-September, and the bullish sentiment metrics rose – the SP 500 sold off sharply.
The FOMC announcement this week where another 25 bp rate cut is expected might be the charm since on July 31 and then again mid-September ’19, the SP 500 sold off to 2,830 level.
Seasonal factors might play a role too – we are shortly entering the strongest period of the year in terms of historical returns for the SP 500, i.e. November – April.
Good breadth is better than bad breadth, and breadth is leading us higher once again.
Since the late January ’18 peak for the SP 500 at 2,872 – 2,873, the SP 500 is up 5.3% on a price basis.
Thanks for reading – more out tomorrow.