With $164 billion in Chinese imports set to see a 15% tariff beginning the weekend and the Chinese retaliating on $15 billion of US goods, and Hong Kong moving further away from what looks like a peaceful resolution, the SP 500 could start September ’19 in an ugly way.
However, there are (what i think) good reasons to remain optimistic on the SP 500 and US stocks over the next few years:
1.) Annualized Return for the SP 500
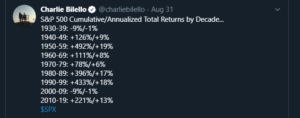
Pension Partner’s Charlie Bilello puts out some of the best long-term technical analysis and capital markets stats on Twitter (@charliebilello). The above tweet from August 31, 2019, shows the cumulative and “annualized” total return for the SP 500 since the 1930’s.
A point made in this blog post, which is supported or confirmed by Charle’s stats, is that while the 13% annualized return for the period from January 1, 2010, to today is healthy, measuring the cumulative or annualized return for the period from January 1, 2000 through current, is still below the “average” long-run rate of return on the SP 500 of 7%.
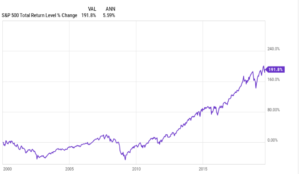
This graph from Ycharts showing the SP 500 Total Return from January 1,2000 through 8/30/2019, shows an “annualized” return of 5.9% i.e. for the 19 year period, that return is still below the long-term average return for the SP 500 and bodes well for “expected forward returns”.
2.) Sentiment – The most Hated Bull Market Ever
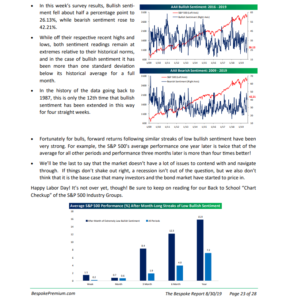
In this Bespoke Report sentiment update from August 30, 2019, Bespoke notes that – since sentiment data started being tracked in the late 1980’s – this is only the 12th time bullish sentiment has been stretched this low (3rd bullet point).
Read the entire page for a bigger-picture look at sentiment.
3.) Good Breadth
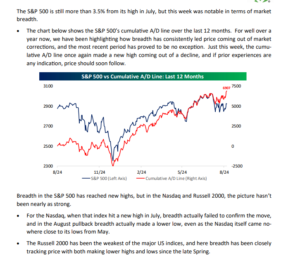
Breadth is currently better for the Russell 2000 per Bespoke, than it is for the Nasdaq.
However that chart for the SP 500 unequivocally shows that “breadth” is leading “price” and I would have to conclude that is a very good characteristic.
Summary / conclusion: Looking at Briefing.com’s calendar of economic releases, the expectation for “net new jobs created” in Friday’s August ’19 payroll report is 170,000 or thereabouts, roughly in line with the expectation of 160,000 to 200,000 per month, we’ve seen for years. Is the yield curve inversion telling us there is a recession ahead, or just that positive yields in the US are so much better than the $15 trillion in “negative yields” found throughout the world, and that the US Treasury market has possibly seen a surge in demand for yield ?
Friday’s jobs report and the FOMC meeting on Sept 17 – 18, will be big events this month.
Technically, 2,820 – 2,825 is the August low range, and 2,945 is the 50-day moving average, which if the SP 500 would close above, would be a positive.
Most technicians think the SP 500 would find solid support at 2,700 on a deeper correction, which means your downside risk is probably 7% – 10% on a market pullback.
Long-term “annualized” returns, market breadth and sentiment are three good reasons to believe the secular bull market for the SP 500 remains intact.
Take all prognostications and predictions with a grain of salt. This is one opinion among many. Be skeptical.
Thank you for reading.