Well, in a word, “yes” which should surprise no one.
Back in the early 2000’s, while writing for TheStreet, there was a fellow contributor by the name of Jordan Kahn, out of LA, (Kahn Asset Management), who I thought was a good writer and investor. Jordan’s framework or process involved the analysis of market fundamentals, technical analysis and sentiment. Todd Harrison, who was Cramer & Berkowitz’s head trader and a partner and a TheStreet contributor, had a similar framework of fundamental, technical, and sentiment analysis, but added a fourth pillar to his work and that was “structural”. Todd was early and active in the emergence of the cannabis trade and I would think that would be a considered a structural change within the US economy, much like autonomous driving or electric vehicles or what might be considered “disruptive” influences on the US economy.
Technical analysis:
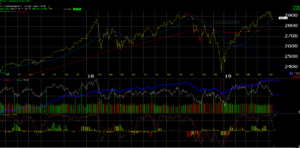
The SP 500 just tested its 50-week moving average this week. The QQQ’s didn’t quite get to its 50-day moving average.
“Trade” matters as we learned with Smoot-Hawley and the Great Depression, but the US economy is far broader and deeper today. Still 35% – 40% of SP 500 revenue is “non-US” so we don’t want to burn the bridge.
Fundamentals update:
Doing the SP 500 earnings post this week, here was the biggest surprise and I want to show readers the entire data set from the spreadsheet:
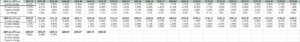
The above is the data from May 10th, back through Dec 7 ’18.
This data set is from Dec 7th, back through September 21 ’18.
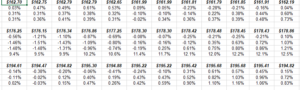
2018 is the top row, 2019 and 2020 are the bottom two sets.
Readers can see how for 2019, the “4-week rate of change” began to turn negative after September 21 ’18.
Maybe even more interesting, 5 weeks later, the “4-week rate of change” turned negative for the 2020 EPS estimate.
The point of this whole lesson is that – this week i.e as of May 10th’s data – the “4-week rate of change” has turned positive for the first time for both 2019 and 2020, since September / October ’18.
We’ll find out shortly if this is “correlation” or “causality”, meaning is this data navel gazing or is there some predictive ability to this analysis for the SP 500’s expected forward return ?
(Inquiring minds want to know. )
Sentiment: It’s really a mixed bag: the shorts are still short, and the longer-term bulls (like this blog) and other are long and will always remain so (it’s the cash and bond allocation that will vary in client accounts in terms of market opinion) but my own opinion is that the US stock market is a long-way from a secular bear market like we saw from 2000 – 2009. Even for the last decade, the SP 500’s return was still positive for the decade, but the average return over that 10 years was just 1.25% – 1.5% per year.
There are so many market sentiment indicators around today, they probably only have some contrarian predictive value when they are all either 100% bullish or 100% bearish.
Structural:
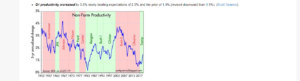
This non-farm productivity graph from Jeff Miller’s www.dashofinsight.com post last week caught my eye, since it makes all the political rhetoric, somewhat moot. For me, the 1980’s and 1990’s was all about the secular build-out of corporate technology, i.e the PC, the laptop, the server, and the gradual broadening of technology within the corporation as a productivity tool. After 2000, I’m surprised at the drop in productivity as technology evolved from the corporation to the individual, i.e the smartphone. The electric vehicle, autonomous driving, personal space travel, (Musk & Bezos), cannabis, robotics, social media, and streaming, are all indicative of the “disruption” occurring in the US economy today, which is always the case for a capitalist, free market economy.
It will never stop. Schumpeter’s “creative destruction” is ongoing and continuous.
Summary / conclusion: While trade worries and trade wars are real and can cause long-term harm to economies, the US is still sitting in the cat-bird seat since the whole world wants access to US markets and the US consumer. China has more to lose than the US in this deal. The thing is, as a communist country still, the Chinese people don’t have the political leverage that the US population does.
My own opinion – and take all of this with a healthy dose of skepticism and denial – is that given market breadth and the health of the corporate credit markets, the SP 500 remains in an ongoing secular bull market that started in either March, 2009 or when the SP 500 traded above its previous all-time-highs in March, 2000 and October, 2007 at 1,575 or so.
What worries me is the 10-year Treasury auction this week that went awry, for some reason. (Here is Bloomberg’s Lisa Abramowicz article.) Was it an early warning indicator for higher interest rates ? Excess supply ? (The same thing really).
More to come this weekend.
Thanks for reading.