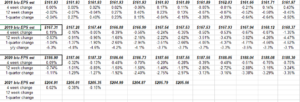
May seem like a small data point but this week showed the first sequential improvement in the “4-week” rate of change in the SP 500 2019 and 2020 EPS estimate since – guess when – September 21 ’18.
At least for the 2019 EPS estimate.
The spreadsheet shows the actual data in the highlighted blocks.
Geeky stuff – but its part of what this blog is all about every weekend.
SP 500 earnings data – by the numbers:
- Fwd 4-qtr est: $171.87 vs $172.03 last week
- PE ratio: 16.8x
- PEG ratio: 3.3x
- SP 500 earnings yield: 5.96% vs last week’s 5.84%
- Year-over-year growth of fwd est: 5% vs 5.2% last week
Summary / conclusion: After the Q4 ’18 correction, the data was reviewed and I noticed the “4-week” rate of change turned lower around the 3rd week of September ’18. For 2019, the “4-week” rate of change has sequentially improved for the first time since that September ’18 date, so let’s see if the 4-week rate of change is an effective forecasting tool, at least in terms of earnings recessions. The SP 500 “earnings yield” remains near 6% as it has the last 4 – 6 weeks, and that’s usually a good sign. Relative to earnings and expected growth, the market is not terribly or even unreasonably valued, and this is after a week of “tariff fear”.
One final metric: Q1 ’19 SP 500 expected revenue growth of +5.6% is actually stronger than than Q4 ’18’s +5.1%. Health Care is unusually strong for Q1 and Q2 ’19 and I’ve asked IBES by Refinitiv for some clarification. Health Care revenue is expected to grow 14% in Q1 ’19, well above it’s longer-term average.