The SP 500 Earnings Yield is at 6.88% as of Thursday, December 20th, 2018. The 6.88% level is now above the highs from the 2015 – 2016 correction but still well below the 8% – 9% hit during the 2011 20% drop in the SP 500.
The forward estimate slid a little this week from Monday’s $170.22 to today’s $169.85. It will be updated this weekend. This erosion is normal as we move through a quarter.
When January 1 rolls over, into 2019, the current EPS estimate for calendar 2019 for the SP 500 is $174 and change. Using the current calendar year 2017 EPS estimate of $174, the SP 500 earnings yield as of tonight’s close is 7%.
Two scary charts:
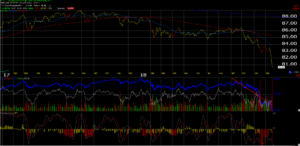
The plunge in FDX has been dramatic. The stock hit a high of $274 in Jan ’18. Its now down over $100 per share in under 12 months and most of that since December 1 when it traded at $230. Some shares of FDX were bought at the 200-week moving average in the low $190’s pre-earnings, but have since been sold.
Still, on price and per Morningstar data, the HYG has fallen 1.3% this year, and measuring performance on NAV, the HYG is down less than 1%.
Clients have no position in high-yield for over 2 years: some was bought after HYG widened out substantially with the 2015 – 2016 correction but it was all sold by the end of 2016.
A 5.5% current yield on the HYG just isn’t that enticing. Energy is a 14% weight in the ETF per the iShares website with “Communications” being a whopping 23.7%.
In 2002, with the TMT selloff (Tech, Media and Telecom) high yield spreads widened out to 13% – 15% and of course between 2007 – 2009, high yield spreads blew out to 25%.
The YTD return on the SP 500 (per Morningstar data) is -4.5% and presumably that return is updated nightly.
Thanks for reading.