Investing is about assessing probability and the performance of the Financial sector the last 5 months, (the XLF anyway) has been less than robust and is testing critical technical support.
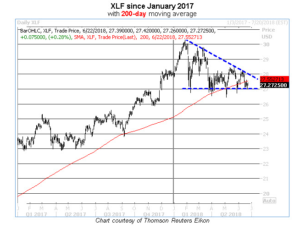
Bernie Schaeffer’s “Chart of the Week” (Schaeffer Investment Research out of Cincinnati) featured the XLF this week, but Bernie’s comments around the put/call open interest for the ETF, did not seem bullish.
Here is some of Bernie’s commentary surrounding the chart:
“The XLF drop below its 200-day was the latest stumble in an ongoing downtrend from the fund’s late-January peak just north of $30, as the shares have formed a series of lower highs since then. However, the $26.50-$27 neighborhood has reliably contained XLF’s lows in 2018. The resulting descending triangle pattern most often has bearish implications, suggesting a reversal of the longer-term XLF uptrend is taking shape.
Against this backdrop, note also that put open interest on XLF is remarkably low at the moment. Call open interest remains fairly robust (2.1 million contracts in open interest, which Trade-Alert pegs in the 71st annual percentile), and has been climbing consistently since the post-expiration decline in mid-June. Conversely, XLF put open interest languished near its post-expiration lows over the last week, arriving Friday at 1.6 million contracts — an accumulation that ranks below 95% of other daily readings from the past year.”
Perhaps a More Important Chart:
Gary Morrow, a hedge fund manager (Yosemite Fund) from San Luis Obispo, California, and an excellent technician, put up the following chart on the website “This Week on Wall Street” this weekend.
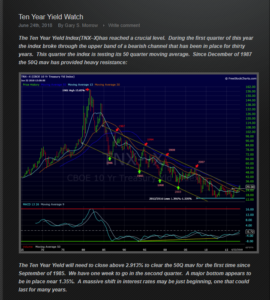
Note the commentary – the 10-year Treasury yield – if it closes Friday, June 29th above 2.915%, will be poised for its first close above the “50-quarter” moving average since September, 1985, or 33 years ago.
That’s a long time.
Conclusion:
Treasury’s and Financial performance seem to be tied at the hip. The XLF has been pulled lower by Wells Fargo (WFC, none held) but JP Morgan (JPM, long) is down from its late February ’18 $119 print to close at $105.75 Friday. The XLF is down 2.25% YTD per the Morningstar data, while the KRE (Regional bank ETF) is up about +7%.
If the yield curve steepens, expect Financial’s to trade better.
There are a a number of tailwinds at present for the Financial sector: 1.) a better US economy, 2.) greatly improved consumer balance sheets, 3.) regulatory reform which should take some pressure off the sector, without sending us back to pre-2008 days, and 4.) higher rates and a steeper yield curve which unfortunately can’t seem to stay steep.
Watch Friday’s 10-year Treasury yield close. That’s an important chart from Gary Morrow.
Thanks for reading.