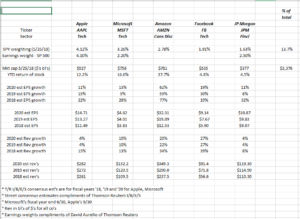
Many thanks to David Aurelio of Thomson Reuters with helping out on the above table.
This blog updates this table at least twice a year. The top 5 weightings in the above spreadsheet were taken from the SPY’s top five weightings as of Friday, May 25th, 2018, per Morningstar data. (Long all 5 stocks with Microsoft being the largest client weight currently.)
Here are the current market cap weights for the 11 SP 500 sectors:
- Technology: 25% – 26%
- Financials: 14% – 15%
- Health Care: 14%
- Consumer Disc: 13%
- Industrials: 10%
- Cons Spls: 6% – 7%
- Energy: 6%
- Utilities: 3%
- Materials: 3%
- Real Estate: 3%
- Telco: 2%
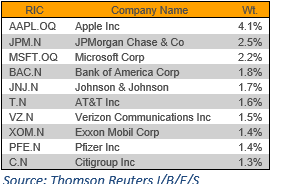
What’s interesting is that Amazon and Facebook don’t even make the Top 10 of the SP 500 by earnings weight:
Commentary / analysis: Readers should note the difference between market-cap weight and earnings weight, and readers should also note that Technology has also risen to its highest market cap weighting within the SP 500 since early 2000.
The difference between market cap weight and earnings weight is typically revenue and earnings growth, as the spreadsheet shows. Note how the earnings weight components are mature businesses, with the bottom 5 components have subdued prospects for growth.
That being said, this blog isn’t here to frighten readers regarding the Tech sector: the valuation of the Tech sector today is far different than 19 years ago.
The top 4 sectors within the SP 500 – Technology, Financials, Health Care and Consumer Discretionary, comprise between 65% – 68% of the entire SP 500. The remaining 7 sectors comprise the rest in terms of market cap.
Remember, too. Amazon and Netflix are the top two components of the Consumer Discretionary sector and comprise 26 – 27% of the XLP Consumer Discretionary ETF. The point is that Amazon and Netflix are not considered Technology stocks.
Adding Amazon alone to the Tech sector would lift Technology’s weighting to close to 29% of the SP 500.
Again many thanks to David Aurelio and the T/R IBES team for helping me get the spreadsheet out in a timely fashion.
Watching the SP 500’s sector weighting changes is a live example of the Austrian economist’s Josef Schumpeter’s Creative Destruction.
Thanks for reading.