Two charts from two very good technical analysts:
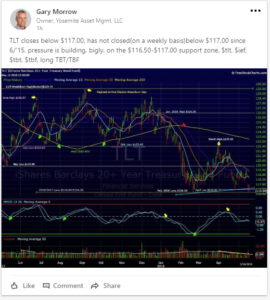
The first chart is from Gary Morrow, a hedge fund manager in San Luis Obispo, California.
Gary is noting the key level on the TLT, which is $116.51 or thereabouts, the lows from late ’16, late ’17, and early ’18. Per Gary Morrow, if $116.50 gives way on the TLT, look out below.
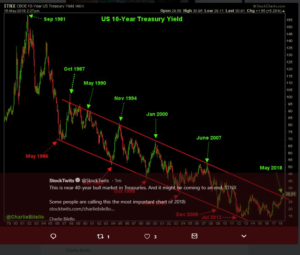
The second chart is from Charlie Bilello of Pension Partners and shows the 40-year bull market in the 10-year Treasury yield coming to an end.
Think about that – 40 years – and the bull market is over given the 10-year yield taking out 3.03% or the 2013 high yield tick.
Technicians are waiting for the 3.22% level to give way on the 30-year Treasury yield.
Analysis / conclusion:
Here is an article written on this blog in early July, 2016 noting the “unrelenting, unforgiving” Treasury trade and ironically just as the most frustration was expressed, the worm started to turn, first with Brexit and then with the election of President Trump and the Republican Congress, both of which were pro-growth and really ultimately, pro-inflation.
This blogger gave up a lot of relative performance from 2010 to 2016 staying away from the “safety” trade, and the “dividend” trade, and Utilities, Telco, Real estate and other smaller sectors within the SP 500. The numbers weren’t bad for clients, they just weren’t great, particularly the drag that the TBF (inverse Treasury) was on what were conservatively-invested bond allocations.
And now all that has begun to change: I was listening to a big bond firm’s portfolio manager on Bloomberg this morning, and this person was saying how he expected inflation to remain “contained” and my first thought was, “how can he know” ? Jobless claims have never been this low – ever. The unemployment rate is 3.9% and the US economy is just beginning to feel the tax reform and the US tax cuts and most American’s wont really know the full effect of the tax cuts until later in 2018.
Plus, there are a whole handful of non-US sovereign credit markets still with negative interest rates. You can wager a decent sum of money that crowd will be late raising rates. At least the Fed is out in front of the US economy and inflation to some extent.
Charlie Bilello’s chart – the second chart – has been circulating for a while – and its a potentially powerful story.
The majority of clients hold a 5% – 10% position in the TBF, and the rest of the bond allocations are in T-bill’s, higher yielding money markets with not much duration risk, and the accounts have been that way for a while. The TBF is up 6% – 7% YTD, while the Barclay’s Bloomberg AGG is down 2% – 3% ? There aren’t a whole lot of bond market sectors with positive returns this year and the pain could just be starting.
There is a whole generation of investors that have never really seen a bond bear market. Michael Batnick over at Ritholtz Wealth Management has written some good perspective on “the bond bear”. Michael actually provides some cautious optimism to bond bears such as myself, and Michael tempers the cassandra’s as I tend to be since I saw 20% interest rates during college, and saw the 10-year Treasury yield at 1.40% in both 2012 and 2016.
Look through that website for Michael’s work.
Laddered bond portfolio’s with individual bonds are one way around what could be a painful period.
Remember bond mutual funds a more “volatile” duration measure since potential redemptions add to uncertainty. Does the market really know how individual investors will react to bond market “extremis” if it does happen ?
There won’t be an SP 500 earnings update this weekend, until late Sunday night or early next week.
Thanks for reading…