With the first quarter expected to end Thursday night, March 29th, 2018, given the stock and bond markets will be closed for Good Friday, the SP 500 could end the first quarter with a negative return despite the large upward revisions to expected 2018 SP 500 earnings per share estimates.
Just since late December ’17, the expected dollar estimate for the SP 500 has risen from $142.28 on the day President Trump signed the first major tax reform legislation since 1986, to last Friday’s current $158.02 estimate.
That is a big increase in the forward SP 500 estimate historically for the last 12 weeks, and yet the SP 500 has hit a major rough patch. The key benchmark could end Q1 ’18 with it’s first negative return since Q1 ’09.
So what gives ?
Economically, the first quarter of every year always seems to be weaker. The final Q4 ’17 GDP print was just released this morning and the Final GDP estimate was revised upward to 2.9% and yet Q1 ’18 GDP is looking at something in area of 1.8% when it is expected to be released in late April ’18.
Per Bespoke January ’18 retail sales were ugly (https://www.bespokepremium.com/get/B.I.G._Tips_-_Retail_Sales_Horribilis.pdf) and if you read the article you’ll see retail sales were weak the year before in the midst of the crude oil decline to $28 per share.
There seems to be something about the first quarter of every year where US GDP is structurally weaker, the SP 500 gets more volatile, sentiment drops, and Wall Street analysts get more bearish (until this year in terms of estimate revisions anyway).
Here is a quick chronology of the last 5 first quarter’s of every year:
2014: following the SP 500’s 32% return in 2013, Venezuela and the Ukraine resulted in the SP 500 becoming more volatile in Q1 ’14. “Positive” estimate revisions for Q1 ’14 never exceeded more than 45% in the quarter, which means negative revisions were 55% or more during the quarter. Here is a Forbes article on Q1 ’14 GDP – yikes.
2015: Crude oil started falling from the $100 level in late August ’14 and it really showed up in Q1 ’15, as crude plummeted, credit spreads widened, Energy stocks continued to tank AND remarkably, the US dollar strengthened dramatically from October ’14 through March ’15. You also had a US West Coast Port shutdown and the Midwest weather was brutal from January to March ’15. Positive SP 500 estimate revisions never got above 43% and really stayed under 40% all quarter. (Here is Q1 ’15 GDP described by Forbes.)
2016: The SP 500 fell 6% the first week of January ’16 and finished down 5% for the month. Positive revisions never tracked over 39%, which means negative revisions outnumbered positive almost 2-to-1. Gold soared, WalMart came out and guided revenue lower in Jan ’16. (Here is the WSJ article detailing Q1 ’16 GDP. ) Again positive estimate revisions never got above 39% in the quarter.
2017: The SP 500 rose over 5% in Q1’17 following the “pro-business” results of the November ’16 election. Positive analyst revisions still only got to 51% during the SP 500 earnings reporting season from January 10th through mid February. (Here is a Q1 ’17 GDP article by CNBC.)
2018: SP 500 could be negative in Q1 ’18, GDP is expected to be less than 2% when reported late April ’18, and SP 500 earnings estimate revision ratio’s were north of 65% – 70%, the strongest in years. (WSJ article from late Feb ’18 on expected Q1 ’18 GDP.)
Conclusion: So what’s the point of all this ?
Every year, the first quarter from January through March seems to scare the daylights out of investors, and analysts (as we can see from tracking the earnings estimate revisions) turn negative, only to reverse themselves in the 2nd quarter of every year.
2018 is turning out to be anomaly: large upward estimate revisions to 2018 SP 500 forward estimates instead have resulted in what could be the first negative quarter for the SP 500 return since 2009.
To his credit, Steve Leisman of CNBC looked at the typical first quarter GDP weakness about a 12 – 18 months ago – and I dont know if he asked Fed economists or independent economists to look at the historical data – but there was no statistical pattern found even though the last few years, to explain the Q1 ’18 GDP weakness, or even if there was a pattern of weakness.
So what should readers take away from all this:
1.) SP 500 EPS estimates and revisions are not a market timing tool, but a longer-term valuation measure. We’ve written before that the SP 500 corrected 20% peak to trough in 2011 and yet SP 500 earnings grew 15% that year. This could be a year of “P.E compression” for the SP 500 where SP 500 earnings grow 17% – 20% on the year and the SP returns less.
2.) Analyst estimate revision trends tend to reflect headlines, news flow and also guidance. Companies are typically most cautious when reporting Q4 earnings and giving full-year guidance and then seem to turn more bullish into the 2nd quarter
Here is what the analyst estimate revision trends looked like in the 2nd quarter for each year mentioned above:
- 2014 Q1: positive revisions 42%, negative revisions 58%
- 2014 Q2: positive revisions 55%, negative revisions 45%
- 2015 Q1: 40% positive, 60% negative
- 2015 Q2: 44% positive, 56% negative
- 2016 Q1: 36% positive, 64% negative
- 2016 Q2: 50% positive, 50% negative
- 2017 Q1: 47% positive, 53% negative
- 2017 Q2: 58% positive, 42% negative
3.) Technical analysis matters:
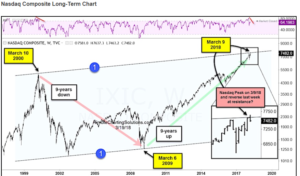
Chris Kimble Solutions emailed this chart to readers a few weeks ago showing the Nasdaq reaching the high end of its trend channel – pretty timely chart.
Just goes to show readers – technical analysis matters.
4.) With the Facebook headlines and really the whole concept of “data mining and sharing” under scrutiny, and the Uber autonomous driving accident, two emerging growth areas of Tech the last few years are under intense scrutiny. Analysts will likely remain nervous until we hear conference call commentary from the key players in April ’18.
Readers could see a Technology correction like the first quarter of 2016, where Amazon fell from $700 in early January ’16 to $474 by february 10th, 2016 for a 32% peak-to-trough correction, and then never looked back after bottoming on little fundamental news.
The valuation on Technology and the Nasdaq is nothing like the late 1990’s – readers could get a nice buying opportunity in Technology in 2018, similar to Q1 ’16.
Thanks for reading a longer post that touched on many aspects of investing, i.e. economics, SP 500 earnings estimates, revisions, sectors and technical analysis.