Source: Morningstar / Ibbotson’s Stocks, Bonds, Bills & Inflation Handbook
The 30-year bond data needs to be updated and the Barclay’s data is now being tracked (now Bloomberg Barclays Aggregate)on the spreadsheet.
The point of today’s post is simply to talk to readers about the concept of “P.E expansion” and “P.E contraction” within the SP 500 and its powerful influence on market / portfolio returns.
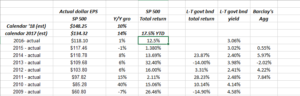
Since the SP 500 bottom in March, 2009 (and using the whole calendar year), and through the current EPS estimate for the SP 500 and the YTD 2017 SP 500 return, SP 500 earnings have grown 81% and the SP 500 – adding the sum of the annual returns each year – has grown 137.1%.
That is an example of P.E expansion which typically occurs in secular bull markets.
What is fascinating to me is that if you look at two of the years within the last 9 years of data, there was powerful “P.E contraction”: in 2010 and 2011, SP 500 earnings grew 40% and 15% respectively, and the SP 500 returned just 17.2% in those calendar years. Readers will recall that the Greece debt crisis, and the Euro bailout of Greece dominated the headlines back then.
Going back a little bit further, if we look at the years 2000 – 2007, it was an entire period of P.E contraction, with SP 500 earnings growing roughly 60%, and the SP 500 returning – for that entire 7-year period, 22.7%
Now, lets look back to the 1990’s, and I’m sure readers can guess what happened:
From 1990 to 1999, SP 500 earnings grew 79% for the decade, while the SP 500 returned 190%.
Analysis / conclusion:
The goal over the Thanksgiving weekend was to write an article at some point on the difference between this equity bull market since 2009, and the 1990’s “fevered” bull market, and you can simply see it in the relationship between “price” and “earnings” in the SP 500.
Already, since 2009, SP 500 earnings have grown 81%, more growth than the entire 1990’s, and yet the SP 500 is up 137%, from 2009, versus the 190% back in the 1990’s.
So SP 500 earnings have grown faster than the 1990’s as of this point in 2017, while the SP 500 has returned far less.
Hmmmm…
(One thing that is a little uncomfortable is comparing decades versus bull market highs and lows, some of which overlap. Until this decade is out, until the end of 2019, the data is overlapping.)
Here is another way to look at the numbers:
- 2010 – 2017: 89% SP 500 earnings growth versus the 111% SP 500 return, assuming the EPS estimate and the SP 500 remain unchanged through year-end 2017
- 2000 – 2009: 29% SP 500 earnings growth from 1/1/2000 through 12/31/2009 versus the 12% cumulative return on the SP 500 from 1/1/2000 through 12/31/2009
- 1990 – 1999: 79% cumulative earnings growth versus the 190% cumulative decade return on the SP 500
Again the whole point of this exercise is to show the much less “fevered” bull market today versus the 1990’s.
This is a much more rational bull, since the SP 500 since 2010, has simply been “walking up” the earnings growth ladder, and there has been much less P.E expansion along the way.
Now with that being said, we haven’t seen a year or two of P.E contraction since 2010 – 2011, which implies that eventually we could see a low to mid-single-digit return year for the SP 500, while SP 500 earnings grow smartly.
A good example of that is 1994, when then-Fed Chair caught the Street off guard with 6 fed funds rate increases, but the US economy was smoking hot and SP 500 grew earnings 19% in calendar 1994, and yet the SP 500 returned just 1% that year. The SP 500 made up for it in 1995 though.
Thanks for reading…