“Sometimes it is good to have reminders of the mistakes you’ve made.”
Brian Bosworth, “The Boz”, ESPN’s 30-for-30
——————————————————————————————
If there is one trade that I haven’t done a good job for clients with off the ’09 low, it has been trying to anticipate rising interest rates and sitting on too much cash within the fixed-income allocations of balanced accounts.
The unrelenting, unforgiving, unrepentant punishment of the Treasury bull market trade has hurt, and now – looking at the two attached charts – the 10-year Treasury yield is poised to trade below its July, 2012 low of 1.39%.
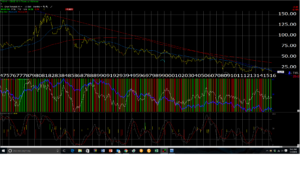
On this “monthly” chart, which is a graphical display of the CBOE 10-year Treasury Yield Index, the 10-year yield is not yet as oversold as its was in July, 2012.
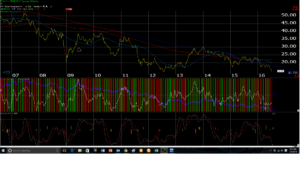
On this “weekly” chart of the same contract – the CBOE 10-year Treasury yield index – the 10-year Treasury yield is now getting as oversold as it was in early, 2015 and again in July, 2012.
In the late 1990’s its wasn’t just the tech bubble that was the issue, it was the complete dominance of large-cap growth that basically left everything in the dust in its path to March, 2000 high. People forget WalMart traded to $70, and Home Depot traded from $10 in 1995 to $69.75 by early, 2000, only to fall back to the low $20’s within the next few years.
Like The Boz quote at the top of the page, to buy Treasuries here leaves me with the distinct feeling that I’m repeating the past mistakes of the 1990’s, chasing a return on an asset class which has all the hallmarks of JDS Uniphase (VIAV) in 2000. (JDSU, now VIAV was trading at $5 per share in 1995, and eventually peaked at $700 in March of 2000.)
And yet, The 10-year Treasury yield could trade to a 1% yield as Scott Minerd, the CIO of Guggenheim and E. Gary Schilling, the long-time bond bull, thinks it can.
But here is the catch or the fly in the ointment so to speak: now “everyone” is bullish Treasuries.
Back in the early 2000’s – really 2003 after the start of the 2nd Gulf War and the recovery in large-cap stocks after the Technology and large-cap growth collapse, the sentiment at that time was that Treasury rates would rise rapidly. CNBC’s Rick Santelli used to give the “JP Morgan Bond portfolio manager duration survey” results every Tuesday morning from the floor of the CME, and the results would be 90% – 95% “bearish” Treasuries (i.e. higher rates) and a far less percentage as bullish.
This went on from 2003, pretty consistently through 2006, and the popular sentiment was ultimately wrong, and not just wrong, but very wrong.
Now from early 2003 to mid-2006, the bearish crowd was right for a while, as the 10-year Treasury yield ultimately peaked at 5.24% in mid-June 2006, but of course very few at the time knew what lay ahead of us in late 2007, 2008.
So what is the point ?
The point is that with Brexit, the weak May ’16 payroll number, the weaker GDP data, the Treasury bulls (lower yield and higher price) seem to – once again – outnumber the bears.
Conclusion: The 10-year Treasury yield closed at 1.47% on Friday, July 1 so watch the 10-year Treasury yield low of 1.39% from July, 2012. Very few people remember that what precipitated the July, 2012, low yield was the worry that Greece would leave the EU and the euro and return to the drachma. The Greeks held a vote around the time of the 10-year trade to 1.39% – and even though a more radical party to the left of Tsipris and Varoufakis campaigned hard pre-referendum, the Greek’s chose to stay in the EU, and chose austerity. (This was a very different vote from Brexit. The issues were polar opposites.)
Could a double-bottom in Treasury yields be forming in the 10-year ?
Treasury sentiment (to me, anyway) seems resolutely bullish once again, looking for lower yields, and it is hard to say that the bullish prognosticators will be wrong.
Once thing I’ve never forgotten from Money & Banking and the Bond Management courses was “real returns” on Treasuries. Even the most conservative inflation measure today puts the 10-year Treasury and in, “under water” from a inflation-adjusted” return perspective, meaning that investors in Treasury’s between 0 – 10 years are losing money, when adjusted for inflation. (Not that “inflation-adjusted” returns matter in Japan or most of Europe.)
The June ’16 payroll report is Friday, July 8th. Consensus seems to be 170,000 – 190,000 for both overall and private sector job growth.
My own opinion is that SP 500 earnings will improve in the 2nd half of 2016, led by Energy and Basic Materials.
If you wonder if stocks can generate decent returns in an economy/market where interest rates rise, note that in 2013, the 10-year Treasury yield rose from 2% yield early in ’13 to 3% by late November, early December ’13 and the SP 500 returned 32% that year. Financials were also the top performing sector.
If the yield curve steepens, in a measured, non-dramatic, fashion, the US stock market could perform quite well.
My worry is that we see an “interest rate” shock and the 10-year Treasury yield rises rapidly after the Treasury pits in Chicago get spooked (the so-called “bond vigilantes”) but I’ve been worried about since March ’09 without success.
Treasuries comprise 33% of the Barclay’s Aggregate, the bond-market equivalent of the SP 500, so Treasuries still matter in terms of fixed-income portfolio returns.
Clients own some TBF (unlevered Treasury short), which has been kept on a short leash.
Watch that 1.39%, all-time-low, July, 2012, 10-year Treasury yield this week. That is our line in the sand…
(Long JPM (the stock), JP Morgan bond funds, TBF, Nuveen muni high yield bond funds, corporate high yield bond funds)
Positions can change at any time.