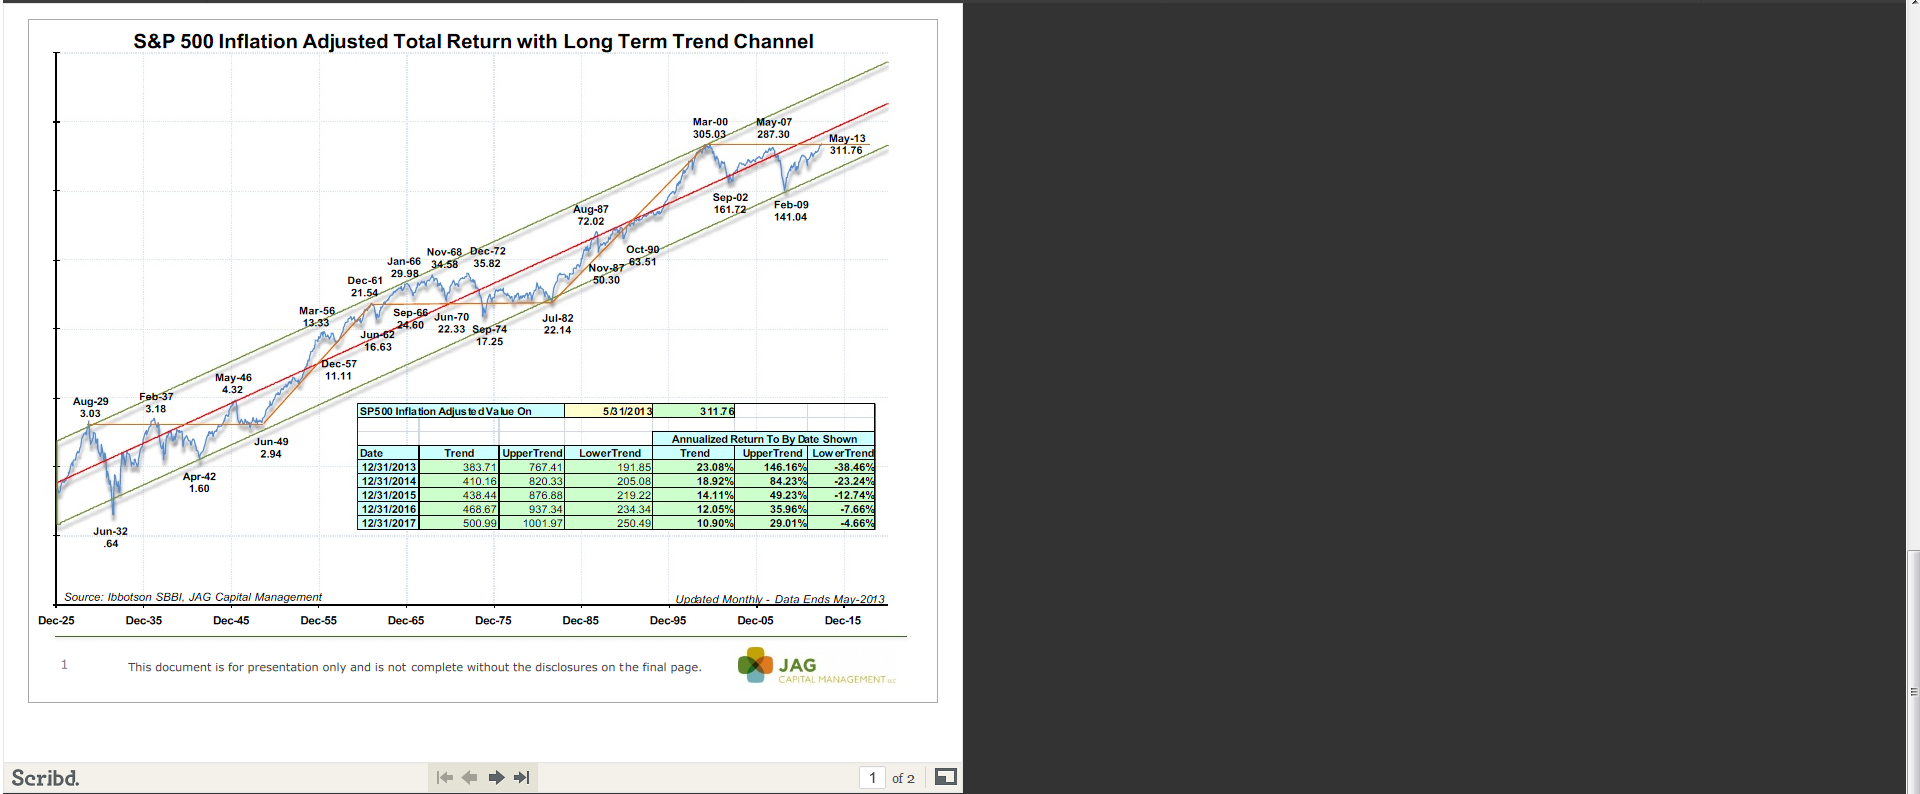
We still struggle with getting our graphs right, but this chart / graph courtesy of Norm Conley of JA Glynn out of St. Louis, tells me that while, we will have corrections and short-term bear markets over time, the probability that the SP 500 goes much, much higher over time is quite favorable.
On an inflation-adjsuted basis, the SP 500 is just recovering its March, 2000 highs. (I wish this graph was available to me in March, 2000.)
What is happening in Japan, despite the 20% correction in the Nikkei and the blaring negative headlines the last few weeks, is a positive as Abe and Kuroda try to break the Japanese economy (still the #3-ranked economy in the world) out of its deflationary grip.
The USA economy will continue to grow, albeit at a slower rate given the fiscal policy constraints, but the US economy will grow.
Note the table highlighted in green in the middle of the chart – the high end for the “inflation-adjusted” SP 500 over the next few years is 1,000, versus late May’s close of 311.76.
Be prudent with your investments, and don’t get stupid, but overweighting stocks vs bonds in the standard 60% / 40% asset allocation today, might not be an imprudent posture.
For current clients we are overweight US large-cap equities, and credit-risk in bond portfolios.
In my opinion (and this is just an opinion), the long 13-year drought in breakeven or negative returns for US large-cap stocks has ended.
Trinity Asset Management, Inc. by:
Brian Gilmartin, CFA
Portfolio manager