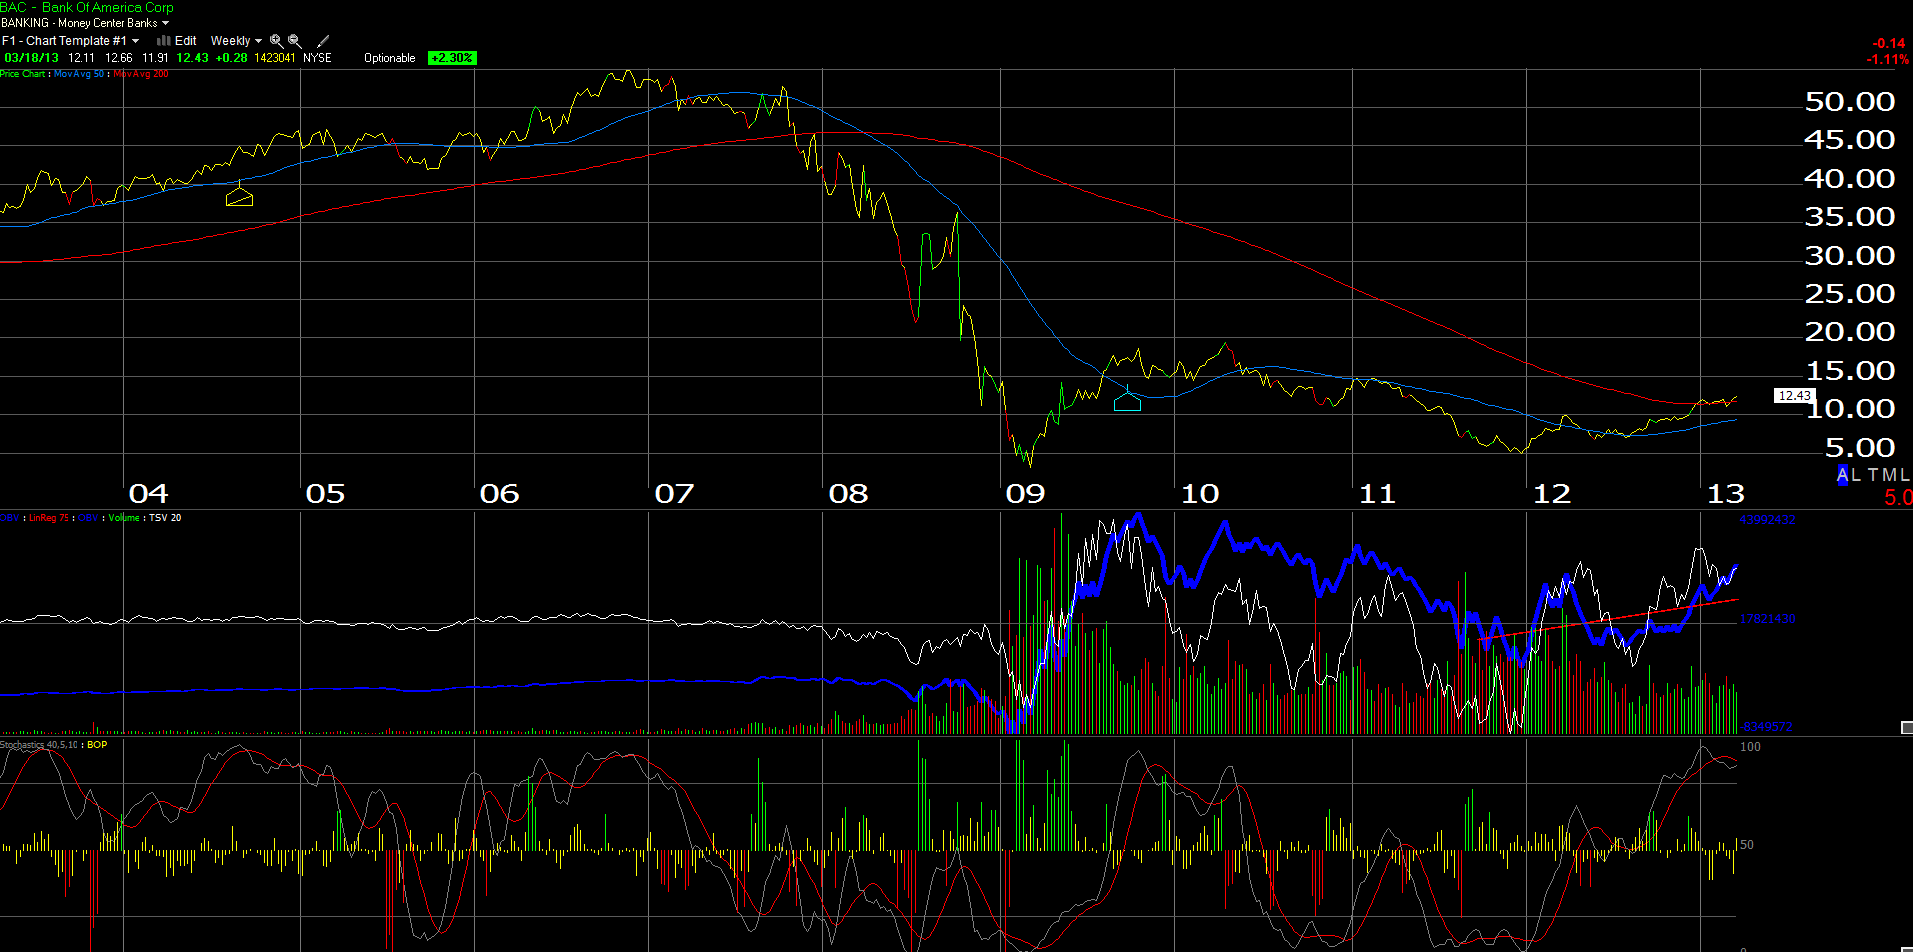
Bank of America (BAC) has edged above its 200 week moving average on the above chart and greatly improved its technical underpinnings. One of the reasons for the technical improvement (we think) is that BAC is a de facto play on the housing recovery, and as they settle these mortgage and insurance issues (from a litigation perspective), and the national housing market gradually improves, the “dash-to-trash” should help BAC’s balance sheet and capital as we move through the decade.
Current analyst consensus is looking for $1.00 and $1.31 in 2013 and 2014, and probably more importantly the downward revisions have stopped, and have started to turn slightly positive.
BAC’s estimated tangible book value (TBV) is roughly $13.50 per share, so you can still buy the stock at a discount to TBV.
If you go back and look at the 2006 10K, BAC had about 4.5 billion, fully-diluted shares outstanding, but today that figure is over 10 billion. The Financial Crisis and the capital infusions severely diluted all bank shareholders, not just BAC.
Given the dilution, it will be a long, long time before BAC sees its old highs near $50 per share.
BAC is now repo’ing shares and paying a dividend, and as we said, we think the bank is a levered play on the housing recovery. We think BAC easily trades to $15, and then $20, and we’d buy any pullback under $12.
Thanks for reading,
Trinity Asset Management, Inc. by:
Brian Gilmartin, CFA
Portfolio manager
312-751-0996