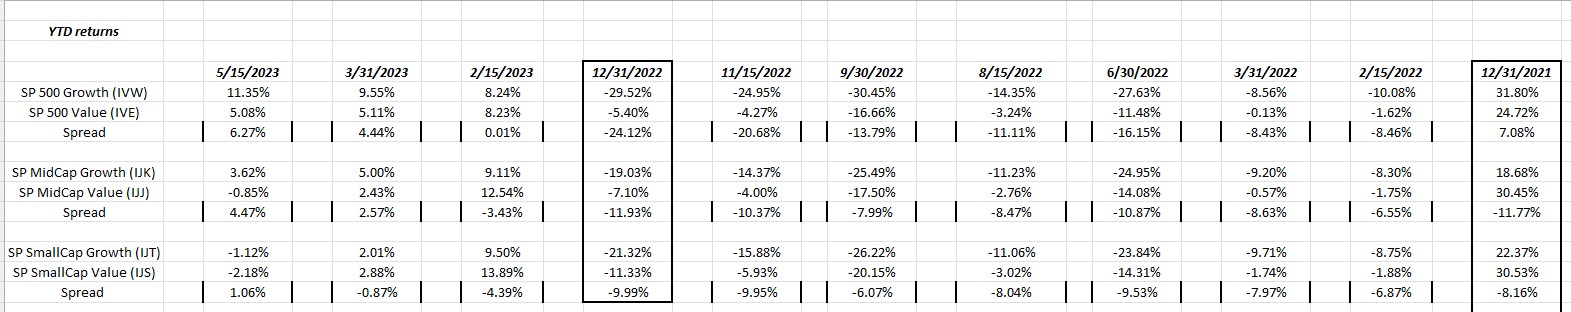
The above spreadsheet shows the relative performance of the various US equity market asset classes, starting with large-cap growth and finishing with small-cap value.
The dark bordered columns are year-end returns for the various style-boxes, while the unbordered columns shows year-to-date returns, until 12/31 of each year, and then it’s started again.
While many are calling 2022 a “bear market” what it really was a year where large-cap growth and growth across the market caps needed a decent correction after a run where large-cap growth outperformed large-cap value for 5 consecutive years, i.e. 2017 through 2021 inclusive.
2023 is now continuing that past pattern of growth and large-cap growth relative performance.
Is the secular bull market in US stocks still intact, whether you put the bottom at March ‘or early May ’13 ?
Probably.
Here is what worries me though:
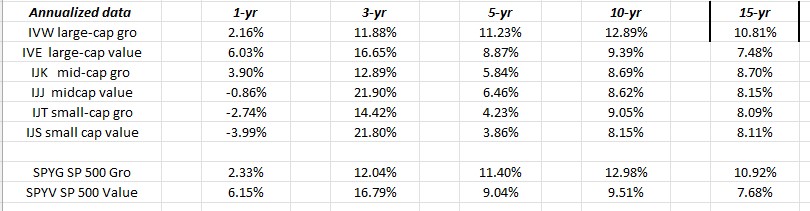
If you look at the 10 and 15-year annualized returns across all the US equity asset classes, even straight value vs growth (bottom two lines), the returns are not all that appealing.
This post was published on 4/20/23 and a bunch of copy cats came out following it, but the fact is the difference between US equity asset classes and non-US annualized returns for the 10 and 15-year time frame is a compelling argument for owning non-US investments. Here’s a post from early January ’23 which speaks to the return differences. The dollar weakness has helped in ’23 YTD, but recently the dollar (DXY) looks to have found support between 100 – 102, while international returns have not yet suffered much.
Summary / conclusions: If I could afford to staff a publishing department and put out the research in a way that would be more consumer-friendly, I would, but like the father of the bride in “My Big Fat Greek Wedding” who sprayed Windex on everything and everyone, all the data analysis goes up on an Excel spreadsheet and gets published like that, so I hope readers can fight their way through the spreadsheet data.
AI and ChatGPT have definitely reignited interest in the large-cap tech names, which is helping the SP 500 YTD.
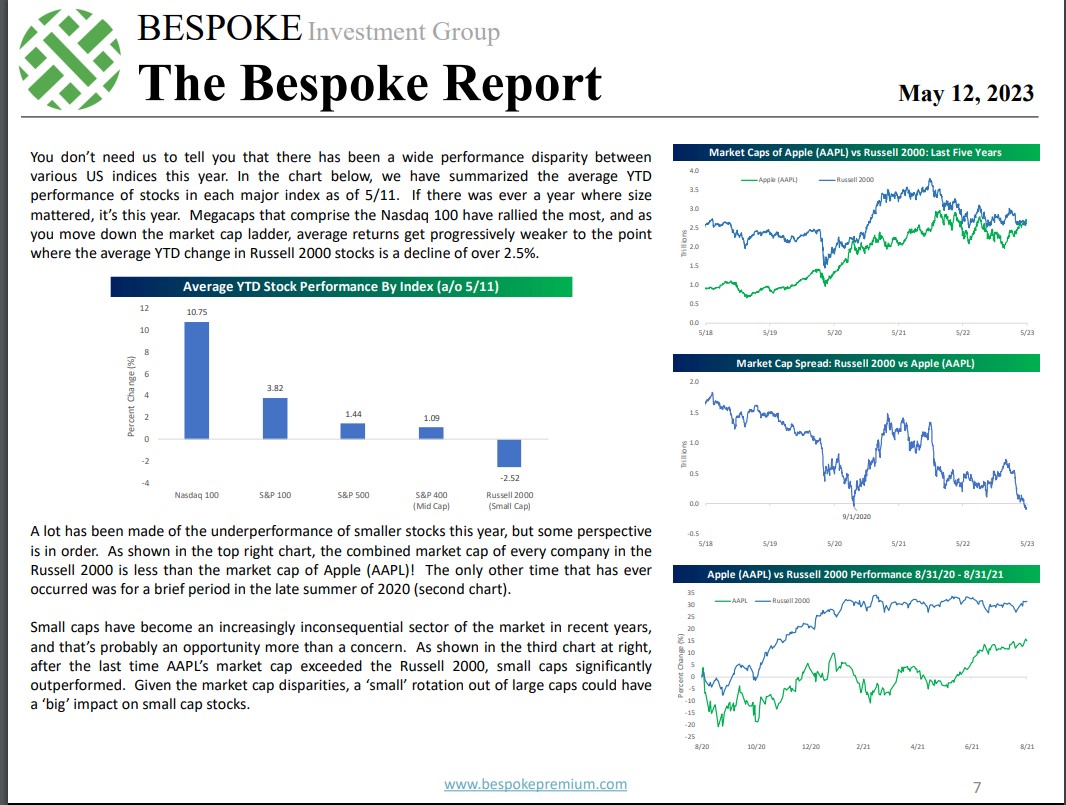
Bespoke noted in their weekly Bespoke Report (May 12, ’23) the returns by index, which is telling.
Supposedly, Apple’s market cap is now greater than the entire Russell 2000 market cap.
It’s hard not to pick away at the IWM (Russell 2000 ETF) here, but technically it still doesn’t look good.
Take all of this with substantial; skepticism, and a considerable grain of salt, and none of this constitutes advice. Past performance is no guarantee of future results. All of the style-box return data is sourced from Morningstar. Capital markets can change quickly for both the good and the bad, depending on how you are positioned. Gauge your own sensitivity to market volatility.
Thanks for reading.