While, we start the final 6 weeks of 2022 next Monday, November 21, we also get a look at the October and November quarter ends for companies reporting in December ’22, but don’t start seeing the majority of Q4 ’22 earnings reports until January 10th – 15th of 2023. We really won’t know final Q4 ’22 earnings results for the most part until Walmart reports in mid-February ’23.
SP 500 earnings really are somewhat of a coincident – lagging indicator.
SP 500 data:
- The forward 4-quarter (FFQE) SP 500 earnings estimate slid to $224.81 this week from last week’s $225.20 (for a $0.39 or -0.17% sequential decline), which is the smallest sequential decline of the last 4 weeks. No doubt Walmart helped but the trend is still a slow erosion as we move into year-end 2022;
- The PE ratio this week ended at 17.6x versus 15.9x as of July 1 ’22;
- The SP 500 earnings yield was 5.67% versus last week’s 5.64% and the July 1 print of 6.31%;
- Some watch the bottom-up estimates: the Q3 ’22 bottom up estimate finished at $55.92 today vs $55.90 last week. At least it’s above $55;
- The FFQE held up until 10/21/22: after that date, the forward estimate fell off the table. Here’s the “4-week change” in the forward estimate since 10/21/22:
- Week of 11/18: $224.81: 4-week change of ($7.81)
- Week of $11/11: $225.20: 4-week change of ($7.82)
- Week of 11/4: $226.72: 4-week change of ($7.67)
- Week of 10/28: $229.54: 4-week change of ($0.89)
- Week of 10/21: $232.61: 4-week change of $1.93
The catalyst for these sharp revisions lower were the mega-cap tech stocks earnings releases which reported the last week of October ’22 and are now announcing layoffs.
This 4-week rate of change should begin to lighten up as we move into late November and early December only because fewer companies in the SP 500 are reporting.
Forward EPS curve and rates-of-change:
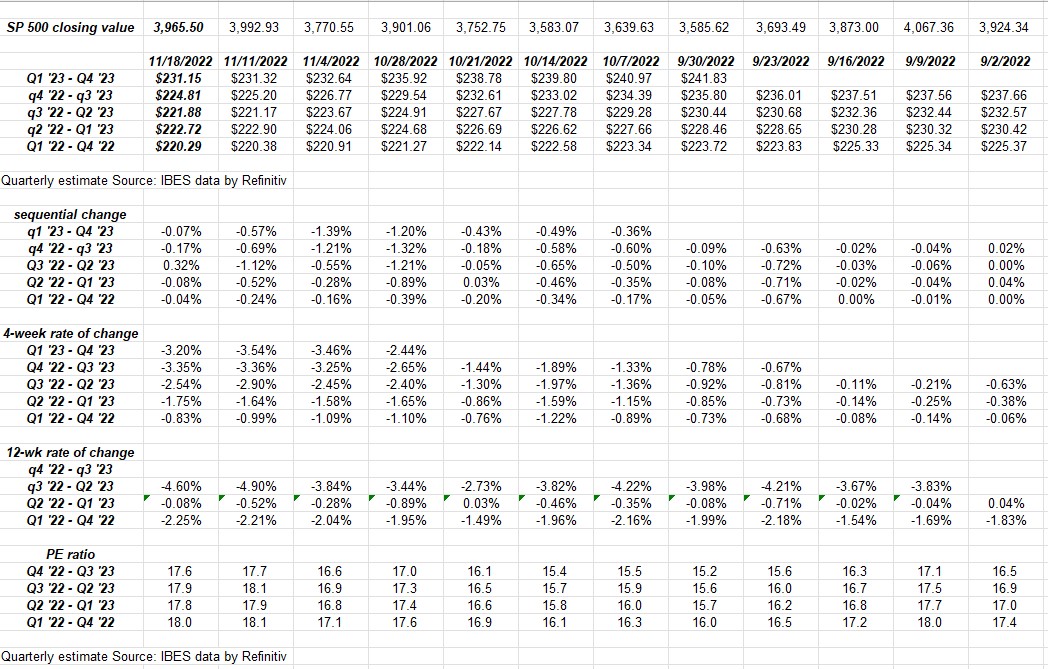
Looking at the various rates of change on the above spreadsheet, the negative revisions slowed this past week. The EPS data is sourced from IBES data by Refinitiv as the spreadsheets say, but all the calculations are mine so anything amiss is on me.
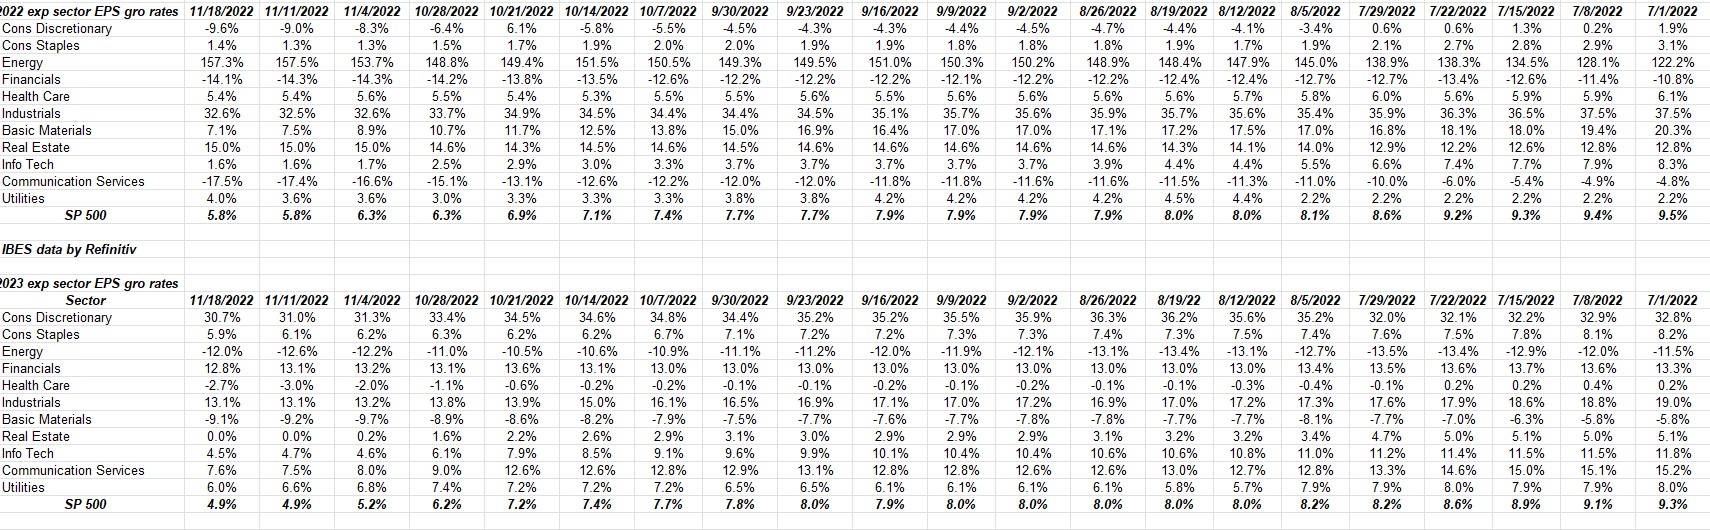
These tables started to be tracked in early 2022, just to keep an eye on how quarterly earnings impacted full-year estimates.
It’s been a slow drip lower all year.
Note though Consumer Discretionary, and Communication Services. Consumer Discretionary is expecting a sharp rebound in 2023 EPS growth. Communication Servies looks currently like the analysts expect a weak year next year as well.
Information Technology or “tech” has lost about 87% of it’s 2022 annual expected growth since July 1 ’22, and in 2023 the tech sector’s expected growth is less than half of what was expected on July 1 ’22.
Those 3 sectors are about 43% – 44% of the SP 500’s market cap as of this weekend.
Summary / conclusion: There is little new in the SP 500 EPS story, although Walmart was a pleasant surprise this week, while Target was not. Retail is so brutally competitive, it’s hard to imagine a world where Walmart and Amazon don’t completely dominate retail, even while one is a consumer discretionary company (AMZN), and the other is a consumer staple (WMT).
Although neither stock is owned, I’ll look at Deere and Best Buy this week in terms of interest in companies reporting. It’s Thanksgiving week so it will likely be quiet after Tuesday.
There is not much to talk about on the SP 500 earnings front since only pre-announcements or better-than-expected results will move stocks.
2022 for the most part has been about PE compression, but as the 10-year Treasury yield has stabilized, the worry is now that SP 500 earnings fall off a cliff.
As the above bullet-point data shows, the forward estimate has been cut sharply since late October ’22, but the market’s so focused on inflation, the SP 500 is higher and the PE ratio is higher even with weaker forward earnings since inflation has started to roll over.
So which part of the three-legged stool wins going forward ? Weaker earnings, lower interest rates, or the jobs market ?
Weekly jobless claims, which are often ignored but is a very important data point since it’s “frequent” and “current” has shown little softening. The last jobless claims number was for the last measurement week of the November jobs report, and it didn’t really weaken much the last three weeks so don’t be surprised to see the November jobs report expectations stay above 250,000 – 275,000 jobs added. (That’s a guess on my part.)
Maybe the Fed will get their soft landing.
More to come over the weekend. Please take all this as one opinion with a healthy grain of salt. It’s one opinion and the data – like the capital markets can change quickly. Past performance is no guarantee of future results and none of this data may be updated.
Thanks for reading.